|
This week our class reached an exciting milestone where each team presented their project scope of work developed in collaboration with community partners. Each team described the background information for the project, their detailed plan for outreach and data collection, as well as the broader significance of the project within the context of Bay Area sustainability. From here on out, we plan to delve deeper into our projects and dive right into fieldwork! 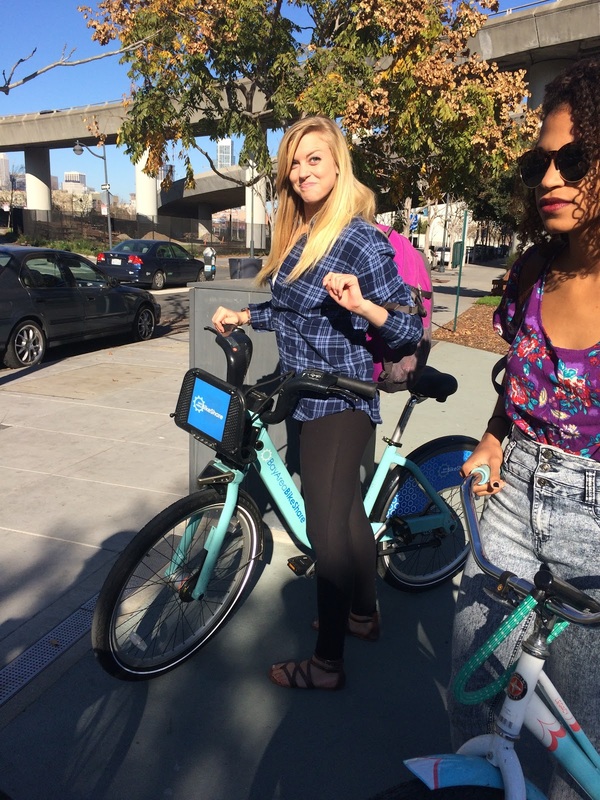 Janice picked us up from the Caltrain Station at 4th Street with our bikes and briefed us on the rules of the road in an urban setting. Our adventure then commenced. We first rode along Mission Bay on a multi-use path which means it is open to not just bikes, but also pedestrians, dogs, skateboards, etc. It was a pretty easy ride as long as we were courteous to other users. Then the real fun began. As we rode down Folsom St. we encountered several new elements: cars, buses, and rail road tracks. It was one of the busier areas of the city in terms of volume of cars and trucks. The bike lanes were useful but we had to deviate from the lane several times due to buses, trucks or cops blocking the bike lane. On this portion of the trip we had to be particularly aware of buses--especially when they stopped, crossing into the bike lane, and then when they left the bike lane to rejoin traffic. Next up on our trip was taking a ride down Market St., the Main Street of San Francisco. This street was equipped with wide buffered bike lanes, with a protective barrier from traffic. The lanes were also painted green and in some intersections there was even bike traffic signals. We still had to be cautious of sometimes passing busses but for the most part biking here felt relatively safe. After Market St. we headed to Duboce Path which led us directly to “The Wiggle”. Janice informed us this path was a vital component of San Francisco’s bicycle network because it was the flatest way to get from the Western neighborhoods to Market Street and Downtown. It is referred to as “The Wiggle” because it is a winding path along several streets that avoids some massive San Francisco hills. Next, Janice made sure to point out a new addition to the San Francisco bike infrastructure, contra flow lanes. These exist on one-way streets where there is a bike lane on each side one going with the flow of traffic, and one going the opposite direction, hence contra flow. These lanes were implemented to shorten the commute time on common paths for bikers by providing a more direct route. We then took a short break and stopped for a refreshing ice cream while Janice distributed some informational materials and debriefed us on the first leg of our journey. Our final leg of our path consisted of traveling back to Market St. to the San Francisco Bike Coalition’s headquarters. We arrived at the office, a little fatigued, but we had survived and were much more knowledgeable about biking in San Francisco. Some of the biggest takeaways from our excursion are:
Why Aren’t More Women Riding? Our Firsthand Experience: The bike ride around San Francisco gave us great insight into some of the difficulties female bike riders might face and making the trek first-hand helped us to come up with ideas of reasons that women bike ridership may not be as high as the SFBC would hope. Below are a few things we came up with that made our trek more difficult, based on our experience today: Insufficient knowledge of the city/navigation skills: Riding a bike in San Francisco requires your undivided attention. Unlike when commuting by car, when you’re on a bike trip, it is very dangerous to shift your attention from the road in front of you (say to a GPS device) or to even take the time to stop and think about where you need to go next. You must pay attention to not only cars and pedestrians, but to other cyclists, and rarely have the opportunity to navigate. If it hadn’t have been for Janice’s familiarity with the city as she led us around, we would have had a much more difficult time figuring out where we were going (which streets to turn on etc.) and such confusion/apprehension can be very dangerous when you’re on a bike. Confusion regarding bike traffic flow: Janice is very well-versed in the significance of “sharrows” and “bike boxes” painted on the road. However, for someone unfamiliar with what these symbols mean (someone like any of the three of us), it can be tricky to make sure you are following the rules of the road and staying in the properly designated areas--particularly when doing things such as turning into contra-flow lanes. Harassment: There were a few instances of cat-calling and other unwanted interactions/attention from male drivers/car passengers and pedestrians. Aside from being distracting and potentially dangerous, such events made the bike ride far less enjoyable. Intimidation by other cyclists: Cyclists can sometimes be aggressive, and particularly if you exhibit “newbie” behavior (riding slowly and cautiously) can be quite intimidating, speeding past you and such. Generally feeling unsafe or physically vulnerable: A few of us found it to be a relatively anxiety-inducing experience--particularly when we were travelling at night. A seasoned cyclist, Janice had the tendency to bike pretty fast, and it pushed a few of us out of our comfort zone. Feeling the need to be hyper-aware of your surroundings at all times, watching out for pot-holes, driver, cyclists, pedestrians, trolley tracks, etc. can be a very overwhelming experience. Impact on hygiene/aesthetic concerns: This one is not as big of a deal, but it is difficult to maintain a sense of “freshness” after biking up a steep hill, and generally getting hot and sweaty. Helmets also inhibit certain hairstyles, and impact all hair textures differently, which may dissuade some women from wearing them. Meeting the Team and Planning for the Future Our bike ride concluded at the San Francisco Bike Coalition headquarters. After a tour of the office, Janice introduced us to the rest of a team of women—Erin, Anna, and Ellie— who are FSBC employees and are involved in getting more women to ride bikes. They all introduced themselves, talked a bit about their backgrounds, and explained what got them involved in the project. A couple of the major themes that we noticed as the team introduced themselves were that they all got into cycling a bit later in life, starting casually and progressing to biking regularly. The all see biking as a form of empowerment. In order to brainstorm some ways to encourage women ridership they talked about their own experiences convincing other women to bike. They all had similar experiences with convincing other women in their lives to ride bikes: once they got a woman to start biking it was pretty easy to get them to continue biking. This insight will inform our tool kit. We may want to focus our attentions on getting women to have a pleasant first experience riding in SF. Ellie then explained to us a little more about their organization. We learned that they are mostly funded from membership and individual contributions, and that their members are mostly interested in FSBC’s political advocacy to improve biking infrastructure. We then moved on to talking about our project. It turns out they have already done some activities to engage women in biking like coffee chats and short film screenings, and we will definitely take these pilot events into account when we form our toolkit. When we talked about what else the toolkit should include, they made it clear that we should fit the toolkit’s contents to our own interests and areas of expertise, but they gave us a list of possible things we could work on. List of possible toolkit items: · Tailored recommendations for San Francisco · Map of where member women ride à talked about possibility of making GIS map · Online forum for women to talk about their experiences and talk to other women that bike · Information on where to concentrate their effort: · What kind of programing works · And what areas should target · Think about metrics to decide whether the program is succeeding · Branding Material · Methods for facilitating average ridership · Creating framework for women mentorship program · Surveying women that don’t bike and trying to figure out why · Finding out methods to target populations that generally don’t bike much · Ideas for fun activities · Web/digital component or booklet We concluded that we would definitely do the mapping aspect they suggested for the toolkit so we started developing action plans on how to do this. We concluded that the first thing we would have to do is send out a survey to send out to the SFBC’s female members to figure out where they commute. At the end of the meeting, our immediate action items were to write questions for a survey that we’ll be sending out to gauge bike ridership in two different areas and the factors that influence it, and figuring out scheduling regarding future visits up to the city. I. Update on Project Activities This week our team worked with Victoria on the ongoing community outreach program for the Oakland Retrofit program. More specifically, we provided our input on the initial survey to be sent out by the City of Oakland to tenants, landowners, real estate professionals. This survey data would provide the critical demographic background that the city would need to make decisions on financial policy, especially the implementation of financial support and incentives. Generally speaking, we suggested that the survey ask participants to describe what policies and practices would be fair instead of asking what would be best for them individually, and explaining in more detail the city’s rationale for incentivizing certain areas or buildings over other areas or building types. If this survey data is made available to us, and occurs within the timeframe of our project, we hope to use this demographic data to create comprehensive ArcGIS maps that would allow the city of Oakland to visualize areas of potential focus. Also this week, we searched for preliminary data to input into a potential map of Oakland, which is described in further detail below. II: What We Learned We have begun to focus our attention on what will be a large part of our final deliverable: the survey. Working on the survey will help us define our scope of the project, because we will become familiar not only with how our project will impact residents, but also who those residents really are. We realized during a group meeting on Wednesday that it may not be realistic to find out specific data for each tenant, but we are confident that homeowner data will be available, and have begun preliminary searches for said data. In the coming week, we will reach out to Victoria and the Building and Housing Manager in hopes to find what we need. The best way to represent the data we acquire from the survey will be through a layered GIS map, one complete with – ideally – house-by-house socioeconomic information. After our exposure to the ArcGIS tool, we have decided to create a map visualizing the “vulnerability” of certain at-risk areas of Oakland. We will finalize in the coming week how to best create this metric of vulnerability with which we will assess the city. It is vital to first have the survey data before moving forward with any policy recommendations so that we may prioritize areas of current policy that need overhaul. These areas will most likely include things like finances, wherein the city ought to consider reworking the 70/30 cost split between the owners and tenants in order to better reflect the income levels of a given household; or community outreach in a language that is spoken in that home. III: Next Steps Moving forward, our team is looking forward to getting more involved with City of Oakland officials working on the project. Victoria is planning on putting us into contact with these officials, after which we plan on scheduling a Skype conference call to discuss our preliminary project scope and deliverables. Camilo has kindly created a decision tree of our project process which encompasses the scope, as well as a graphic listing deliverables at all project phases. Of particular importance for our team are the ArcGIS maps we plan on creating as well as an outreach pamphlet comprised of these maps, information about soft-story risk, and resources available to them (as tenants or landlords) presented in an easy-to-understand and digest format. We hope that our map will be able layer together soft-story building information, seismic shaking risk, regions of liquefaction, class/ethnic distribution by neighborhood and information collected from the survey being currently prepared (should the information be made available soon enough). If these layers prove to dense, we plan on brainstorming a specific metric encompassing these factor that can measure vulnerability (an inability to recover from soft-story collapse) that can be applied graphically. In order to figure this out we have set up a meeting with David Medeiros, Stanford’s geospatial instructor and reference specialist, for next week to talk through some of our initial ideas and determine what actually is feasible given our experience and time-frame. Further down the pipeline, our group plans on attending some community outreach meetings. Before that we plan on thinking of some questions to ask members of the community who attend; currently our only idea is for feedback on our vulnerability metric but more will surely pop up as we became more engaged with others who are working on the project and have unique perspectives and experiences. This week our work on the Friends of Caltrain project was focused on preparing for our first formal meeting with our community leaders. We met at Coupa Cafe with Adina Levin, Executive Director of Friends of Caltrain and Charisse Lebron, Director of Health Policy and Community Development for Working Partnerships USA. The primary purpose for our first meeting was for us to better understand the exact question and problems we would be tackling together over the course of the project. However, before jumping straight into this, Adina gave us some necessary background information on the current state of commuting and transit in the South Bay.
The county of Santa Clara has just recently approved a project that would bring Bay Area Rapid Transit (BART) to San Jose leading to an anticipated increase of transfers between transit operators in the area. However, Adina relayed her experiences talking with transit professionals, explaining that they often view commuters of different modes as different audiences, leading to a somewhat "separate but equal" mindset between transit options such as heavy rail and bus service. When linking this to available data on transit riders and their income levels, we began to focus our research question around the subject of equity issues in transit options across socioeconomic brackets. Are lower-income service workers being priced out of certain transit options? Do current scheduling practices present a barrier to transit for those who may hold multiple jobs? Questions such as these informed our discussion and brought us to our main focus. In 2016, the Silicon Valley Leadership Group will be presenting a ballot measure to the Santa Clara County which would propose a pilot program for fare integration across transit operators in the area. Our goal as a project team is to provide data and ultimately a hypothesis for recommendations as to how this fare integration pilot system might work. Adina and Charisse then broke this goal down into three different deliverables. First, they would like us to produce a literature review of existing fare integration schemes so we can see how other groups and governments tackled the same issues we are currently facing in the South Bay. Second, we will be responsible for creating and administering interviews and surveys of several commuter populations in Santa Clara County so that we can better understand the problems they face when choosing how to commute every day. With these two materials they then want us to provide possible recommendations to alleviate the difficulties faced by local commuters outlined in our research. Ultimately, what was most helpful for us was that Adina and Charisse really focused on how our project was a type of advocacy. In some cases, transit operators may put their own needs and priorities above the transit rider. Fears of revenue shortfalls and complicated cooperation have greatly slowed efforts to develop an integrated fare system, which has lead to many commuters' problems going unanswered. Our main purpose in this project is to find out what exactly these problems are, back them up with reputable data, and bring these to transit operators to show how they are failing to meet their goals in providing adequate transit service to all residents. This is an essential goal of our project that we must always keep in mind throughout the quarter to keep us on track. Looking forward, we've planned our next group meeting for Tuesday February 3rd where we will present a draft for the survey and interview questions. We ended our meeting with a brainstorming session to begin thinking about what subjects we want to address through these questions. We also identified our language strengths throughout the group as our data collection will most likely be from multilingual populations. (Marty and Connie noted their proficiencies in Spanish and Adina mentioned the possibility of us having a volunteer interpreter if needed.) Our next week will be spent putting together this information as well as compiling our Scope of Work. 1) Update on Project Activities
In last week’s blog, we mentioned setting up logistical infrastructure for our project. This week, we set up the interface that will allow us to successfully interact with CLSEPA’s former clients. Jason, our community partner, emailed us survey questions for our review, which we later translated into Spanish. Some of the clients we will be speaking with do not understand English, so we created a script that will facilitate the translation process when speaking to them on the phone. After signing Non-disclosure Agreements and other volunteer paperwork, we were given the data for approximately 200 former clients, all of whom we are expected to call and collect more data from. Jason sent us a spreadsheet with all of the relevant data that he compiled for us in order to proceed with the project. Starting next week, we plan to start calling clients and recording information using a Google survey form that will easily compile the information for us. Our goal, moving forward, is to call approximately 20 clients per week each, which will give us space to try clients who don’t respond the first time again. Earlier this week, we were required to attend an ArcGIS workshop class, which we learned a lot from (thanks, David!). After we’ve collected some data from clients in this next week, we hope to come up with interesting and useful ways of representing our collected data using ArcGIS software. 2) What We Observed/Learned Signing the NDA and volunteer paperwork really opened our eyes: the project was becoming a little more “real.” We realized that we’ll be dealing with sensitive information and that we are expected to uphold a certain level of explicit trust with CLSEPA and implicit trust with the former clients. Deland also raised a good point in that our group should develop a strategy for having open conversations of affordable housing, sustainability, and other main themes, while remaining cognizant to maintain client confidentiality. We expect that it will be challenging to speak to some of these clients. Although our primary purpose is to collect data, our human nature is to empathize with their situation. Jason warned us that some clients may want someone to talk to about their situation on a more emotional and psychological level. In terms of volunteer-client interaction, our only expectation is to ask the survey questions and collect data, so we will need to learn to strike a balance between listening to former clients’ responses to survey questions and tangential stories that they may feel the need to express. The information that we collect will be a mixture of quantitative and qualitative. The challenge here is finding a meaningful way to represent it using ArcGIS software. In this week’s workshop, we learned of the infinite possibilities to use ArcGIS to map our data, and of how easy it is to convolute that data by including too much information. It is our priority to present our data in a fashion that is clear to understand and leaves little room for dispute. David Medeiros, Geospatial Instruction & Reference Specialist, made us aware of the wealth of information that the Geospatial Lab holds and the resources available to us as students. We really appreciated him taking the time to lead this workshop because the intricacies of both ArcMap and ArcGIS make these programs daunting for first time users. Before the ArcGIS workshop, our only focus was creating a map that showed the movement of people from their original residences to where they moved after eviction, however, we were shown tools that allow us to correspond this movement to other socioeconomic factors based on the layers we choose to invoke. One of the most interesting things that David touched upon was the difference between vector and raster images. Choosing between the more basic, geometric vector images and the complex, real-life raster images changed the aesthetic of the overall product immensely. With a basic understanding of the two ArcGIS programs under our belt, we are eager to begin collecting good data as a foundation for these future images. 3) Critical Analysis Even as we just first begin to make calls, it is already becoming clear that we will have to find a way to communicate the impact of their contributions. These are populations that have already been isolated and victimized by institutions that are supposed to protect them. It is our suspicion that it will be hard for them to trust us right off the bat. We will have to communicate with each other to figure out strategies that promote safeness and help them to understand where the information will be going and what impact it will have on public policy and future generations. In particular, since we are interfacing very personally with the populations, we will have to tread carefully about our Stanford affiliation. Our first step is setting up voicemails for our google voice accounts that align themselves with CLS-EPA and make it very clear who we are working for. The questions that we will be using for the survey were supplied by Jason and while we did some preliminary revision, it will be very important for us to have continual revision throughout the process. Part of sharing strategies will be to share how different people/populations react to certain questions or whether different wording will be more effective for the type of responses that we want. Along with communicating the impact of their responses, it will also be important that our final deliverable is accessible not just to policymakers, but to the populations that the evictions are impacting. We will have to work heavily with the GIS lab experts to create a map that is understandable to anyone that accesses it and needs the information. Ultimately, we’d like our final map to create a very clear mandate about the state of things now and what should be done about it. |
Archives
November 2020
Categories
All
|
 RSS Feed
