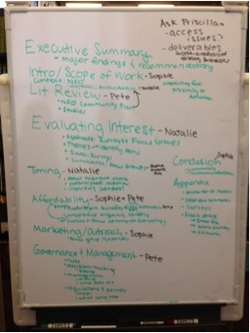
 Update on Project Activities This last week marked the beginning of the end of our project activities as we began to draft plans for our presentation and final deliverables. We decided on a handbook format for the final product that we will hand to Priscilla. Our aim here is to provide her with a comprehensive document that outlines our recommendations (based on our methods and findings) for each component of farmers market establishment. Our recommendations will be accompanied by explicit steps that Priscilla and her team can follow as they move forward. The open office hours session on Monday was spent mapping out the sections of this handbook and allocating work to group members. The picture to the left shows our brainstorming. In conversation with Priscilla on Wednesday, we revisited our original deliverables as they were presented in our scope of work. We wanted her to know how our scope of work had changed over time, and we wanted to make sure we were including everything she hoped to have in the end. As a result of this conversation, it was decided that we needed to do a bit of price surveying in local markets and grocery stores to provide Priscilla with a few produce price points (say that three times fast). Just today, Pete visited Foods Co., Chavez, and Sigona’s, some of the most frequently referenced grocery stores among our survey respondents, to collect price data. Another major task leading into these last couple of weeks has been entering and analyzing our survey data. We ended survey collection with 98 surveys – 69 patients and 24 staff (5 missing clinic affiliation information). What We’ve Learned Our survey data hasn’t necessarily shown us anything surprising, but it has provided us with concrete numbers to help answer some of our questions. In terms of interest levels, 100% of staff who took our survey and 83% of patients who took our survey expressed interest in having a farmers market at FOHC. 95% of survey respondents said they would shop at a farmers market before or after a scheduled appointment. 82% said they would shop at a farmers market even if they didn’t have a schedule appointment, which was a promising result for us – we expected fewer people to be interested in coming to the clinic only for the purpose of visiting a farmers market. 26% of survey respondents knew that they are WIC eligible, and 21% knew that they are CalFresh eligible. The top five most desired fruits and vegetables (which were used for our price checks at grocery stores) were apples, oranges, carrots, onions, and spinach. A snapshot of survey data Another major learning point this week: this type of community planning takes time. Lots of it. It would be great if, at the end of Week 10, we could have a stand opening up at FOHC to sell produce to the passing patients. Realistically, this moment may be a year or two away. The work we’re putting in now is valuable in its own right, however, and must be done to help Priscilla carry out her farmers market vision in a credible and appropriate way. 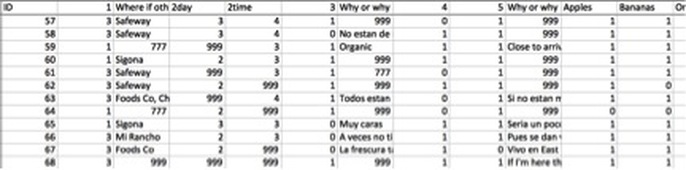 Critical Reflection The survey data also showed that 74% of survey respondents are satisfied with the produce from the stores at which they currently shop. This begs the question: even if clinic staff and patients express interest in having a farmers market at the clinic, do they really have a need for one that would motivate use and support of the market? This question, along with compiling our results and recommendations, has forced us to look back and reexamine our initial purpose and Priscilla’s initial purpose. North Fair Oaks, in many ways, is not really a food desert. But, according to Priscilla, the population they’ve seen at the clinic has been suffering from increasing rates of nutrion-related disease such as diabetes and overweight/obesity. Consequently, perhaps the biggest role a FOHC farmers market could play is not one of increasing food access or making produce more affordable but is one of tying food choice and eating into the patients’ healthcare and wellness. It is from this perspective that we will frame our final presentation, drawing from FOHC’s vision of total wellness. Descriptive
In the past week our project transitioned from the gathering datastage into transforming our data into a concrete deliverable. Natasha and Caroline conducted one last interview on Wednesday in San Francisco, but other than that we have spent our time editing our audio files and photos so that they could be inserted attractively into our map. Natasha and Caroline have been selecting the most informative and important sound bytes from our interviews and uploading them to the audio sharing site SoundCloud so that they could be accessed by Jordan to plug into the ArcGIS map. We have been trying to select the most important parts of the interviews and are trying to keep the clips no more than three minutes so that the map can be meaningful to people no matter how long their attention span is. Jordan has been working on the mapping portion and has encountered numerous problems along the way. The ArcGIS online software is deceptively complicated to use as it requires a substantial knowledge of JavaScript and HTML. With only a basic knowledge in Java, Jordan had trouble adjusting the templates provided by ArcGIS to be able to incorporate our audio component. We met with Patricia on Tuesday to receive help, but she also didn’t know how to incorporate an audio component in a way that did not require coding knowledge. However, after several hours of trial and error, we found a way to embed audio into an existing template. While this method is not ideal and not exactly what we had envisioned, it is a serviceable method that will work for us. We are committed to finishing with a deliverable that will effectively tell the stories of the people we have interviewed, and we are well on our way to doing so. Interpretive Now in the midst of the more technical phase of our project, we have run into some compelling ideological quandaries. In the map-making process, we have looked into using a number of media-sharing websites such as Vimeo, SoundCloud, and Flickr, and in doing so, had to confront the paradoxical nature of this project. Many of our interviewees have expressed a great deal of resentment towards the tech population inundating the Bay Area, and the gentrification of the area is most commonly attributed to this phenomenon. In trying to spread awareness about this issue using mapping, the reality is that these tech companies offer accessible and sophisticated tools for social media sharing. This is an irony we noticed immediately when Erin and Julia asked us if we had any programming skills, and it is certainly one that is apparent to others; Melanie from KALW is focusing on this very paradox for her story about the Anti-Eviction Mapping Project. Is it really a paradox though? While in some ways, it could be perceived as hypocritical to bemoan tech people’s presence while benefitting from the tools they share with us, there are certainly other ways to think of it. For one, the people we have interviewed do not take issue with the tech industry itself--they take issue with the elitist and classist character of this particular industry. It is not the work that these companies do that is the issue, but the way they situate themselves within the Bay Area community. Social media is now an integral part of our society, and if it is a powerful tool for spreading awareness, it should be used. Another way to think of the paradox is within the framework of “reclaiming.” If the tech industry is one that has inflicted hardship and loss on many already disenfranchised people, then why shouldn’t those people use technology themselves, to make their stories and frustrations heard? Applicative: On Wednesday morning before class, we interviewed Michael in North Beach. He had much to say on his eviction. Needless to say, he was not going to be displaced without a fight. He fought his eviction with attorneys and the battle lasted for years. The stress and heartbreak of the entire situation also contributed to the separation from his partner of over a decade. He was fortunate enough to find another apartment in North Beach, however he now lives with neighbors and is in close quarters. He says there is nothing quite like his previous home. His thoughts on San Francisco are now changed. He says he feels as if there is a more inconsiderate undertone to people’s actions within the city. Michael was very welcoming and eager to share his story and we think he will add to the depth and personal detail in our map. Additionally, we had another phone interview scheduled with a person that was displaced from San Francisco and actually had to move to Los Angeles. Unfortunately, we were unable to get ahold of her and she did not answer any of our calls when the week of the interview had come. This has happened multiple times throughout our project and scheduling problems have contributed to our small number of interviewees. This past week we have been editing the audio from the interviews. In order to do this, we upload the audio tracks onto iTunes, convert them to podcasts, and then edit the clips in garage band. We have sectioned off each of the clips into categories unique to each individual and are going to input these sound clips that last about a minute long into the map. Each interview was about 35 minutes long, but we have selected about 8 minutes from each interview to highlight and feature on our map (along with the ability to listen to the entire interview). We feel that these short clips will be most user-friendly and their length will not be off putting as they are short enough for an audience to feel that they have the time to listen. The progress on the mapping project was slow but steady. We continued to work on the map using ArcGIS online software, and found it to be deceptively complicated to use. While it is advertised as six easy steps and has a very intuitive interface and website, it required knowledge of JavaScript in order to render the template they provide into what we wanted. I worked for a long time to modify the existing templated provided by ArcGIS online so that it would incorporate our audio component. I found an example story map provided by the Smithsonian that gave an audio tour of christmas music around the world. I tried to copy the element’s of the Smithsonian’s map into the template I had, but we could not figure out where the code differentiated and it appeared to be exactly the same. My small knowledge of coding and JavaScript was limiting, and the ArcGIS software was starting to appear more and more out of the scope of our project. Through trial and error, I was able to find a serviceable method that will help us make the map, although it is not in the ideal format that we would prefer. Everything we have done so far in this project has been a learning process, including the mapping experience. The ArcGIS software required more coding knowledge than was advertised, and perhaps we should have explored our options further before becoming settling on software that we thought was within our scope of knowledge. Our project is coming together and it is extremely rewarding to see our hard work and the openness and willingness of our interviewees on a platform that will be accessible to the public. The multimedia aspect of our map really adds an interactive touch that will attract audiences to learn more about the real issues of eviction. In the end, we hope to be steps closer in the aid of spreading awareness of no fault evictions and eventually reconstructing the Ellis Act so these don’t happen again. Descriptive
We have reached the final phase of our project! This week we dove full-court-press into preparing our final presentation and more importantly, the design recommendations that constitute the bulk of our project. In order to do that, we spent a good deal of time coding and analyzing all the outreach material we have gathered thus far. In order to do this, we stuck adamantly to our timelines and deadlines and split up the work so that each person completed equally weighted tasks. First, we sifted through all the interviews and surveys we have administered. We typed up all the SF Bicycle Coalition member interview notes as well as the Golden Gate Park interceptor surveys. This took a fair amount of time, especially transcribing the lengthy in-person interviews from their recorded form. We also inputted our online surveys into spreadsheets where the information is clearly accessible and legible. These processes helped us visualize the information so we could discern trends and patterns in our gathered information. Specifically, we were always harkening back to our major project questions: By what means and through which entrances do San Franciscans enter Golden Gate Park? How effective are these transit options and how can they be improved? We believe we discovered some key information from our outreach, which will be discussed below. We also transcribed the workshop materials from Lawton Middle School, where we had asked each student to design on a map their proposed improvements to the 34th and Lincoln intersection. To further our involvement with Lawton Middle School, we created an online survey for Mr. Streepy to distribute to his other 8th grade classes to whom we didn’t present. Although we’re running short on time, we hope this yields some additional information before our final presentation. In terms of the actual design recommendations, we devised our preliminary list of design recs right on schedule for Week 9. We plan to have this list finalized by Sunday night so we can send it to Janice for approval. Our list consists of three major sections: “compulsory” recommendations which we feel are most important and efficient to improving the existing conditions, a menu of further recommendations which improve upon the baseline list, and a complete street road diet. Dividing our recs up into these three sections helped us compartmentalize all our ideas and streamline the many recommendations we’ve envisioned so far. We are currently creating visual and multimedia designs so that we can demonstrate these designs most effectively and engagingly during our presentation. To that end, we have started to create the presentation itself so that we have plenty of time to practice it before Wednesday. We determined which member will present which section, and allocated a time slot to each part. We expect these time slots to be fairly rigid so we can include all the necessary information within the confines of the presentation. Looking forward to Wednesday, we have created a timeline for the work we will accomplish each day so that we stay focused and on track. Interpretive & Applicative We have decided to concentrate on three entrances along Lincoln Way, applying our design recommendations to 34th, 19th, and 7th Avenue and Lincoln. Meeting for several hours a day before our final presentation will allow us to fully develop our recommendations for the entrances and Lincoln Way itself. We will also tend to a range of recommendations for the entire boulevard and the Panhandle entrance recommendations for cyclists. This week’s activities and group meetings have proven very valuable to us as a group. With the ability to capitalize on class time to bring in our project details, we were able to establish an order of presentation goals and the amount of time we plan on spending on each. We plan on spending 2-3minutes giving a summary and project description along with a timeline and introduction of Community partners. In this section we will introduce Janice, Mrs. Tang, The SF bicycle coalition, and walk SF. This Section will be presented by Eric Laetitia will discuss our outreach techniques and involvement in the community in a 2-3 minute period as well, also doing the majority of the Sketchup designs and formatting of the powerpoint. These two sections will prove very valuable in both highlighting key quotes and interviews we were able to conduct throughout the project. The Sketchup designs will provide for a visual of our implementations and design ideas for each intersection. We learned through the numerous presentations by individuals like Chris Lepe, that visuals are more powerful in a PowerPoint than general statistics and wording. Amy will be in charge of design recommendations, implementations, and overall guidelines of these design ideas. This portion of our presentation will take the most time and allow for the most detail. We agreed as a group on all three sections of the project and have a strong and structured plan as to how we will be presenting. Something of concern we discussed was the possibility that our project could turn into the regurgitation of information from community partners and members of the community we have worked with. To prevent this we will be focusing on important quotes from these sources that will support our original ideas and newly formed ones without lacking interpretation of the information we have received. The remainder of the time will go to thanks and what we learned about service learning and will be the portion of the project we present collaboratively. With very structured goals for each day, we will be able to put together a very concise presentation. Update on Project Activities
Now that we are coming down the final stretch, this week was rather stressful for Ma’ayan and Sam. Our objectives this week were twofold: complete the web application for our mode shift data and compile our interview transcripts for the TDM study. As of writing this reflection, I can proudly say that both tasks have been accomplished! Before we could upload our final data to the internet to begin work on the web app, there remained one obstacle to overcome in ArcGIS Desktop. Although we had calculated normalized mode share percentages for each data set, we had neglected to “normalize” the commuting worker population for each radius around the Caltrain stations. To fix this, Ma’ayan and Sam had to follow a complex procedure that required joining data from multiple layers and recalculating fields before creating new dissolve layers for each map. After finally completing this lengthy and draining process, we had thought that our ArcGIS days were finally behind us. Unfortunately, as we began uploading data to the website, we found one glitch remained. We had forgotten to label each Caltrain station in the spreadsheets, which up until now had been represented simply with an ID number. After making a final round of joins to the feature layers, we were finally ready to export our data and bring it online. Today (Friday) was devoted to constructing the web applet. Ma’ayan and Sam put in the hours and now have a functional, largely complete application viewable online! The website can be viewed here (ArcGIS account required to view!). On Wednesday and Thursday of this week, we set aside time to conduct telephone interviews with TMAs from around the country. On Wednesday at 2PM we had a conversation with Chris Hagelin from GO Boulder, the TMA for Boulder, CO. At 4, we dialed James Paxson from the Hacienda Business Park in Pleasanton. Then, on Thursday, we interviewed Chris Hamilton from the Arlington County Commuter Services. All three interviews were informative, and the representatives we spoke with were excited about our project and eager to share their knowledge and expertise with us. What We Observed and Learned Boulder, Hacienda, and Arlington County each have a unique TMA funding system and structure. In Boulder, funds are collected through a citywide sales tax and federal funding, GO Boulder receives $5 million per year, and the TDM component has a budget of $650,000 per year. At the Hacienda Business Park, property owners pay for the TMA through a covenant drawn up between the owners, based on acreage. In Arlington County, a $10 million budget is drawn from a variety of sources, most surprisingly through commissions on the sale of transit tickets for the region’s two transit agencies. Different TDM policies have proven most effective for each region. In Boulder, the eco-pass rules supreme. Neighborhoods, employers, and other agencies can pool together to purchase these transit passes in bulk for residents and employees. Businesses can receive rebates to facilitate the purchase further, and the passes have contributed to a dramatic decrease in SOV trips during peak transit hours, from 80% to 38% SOV. Hacienda provides BART passes to its employees as well. The Arlington County Commuter Services has found that the most effective strategy is to engage directly with business owners. By encouraging employers to adopt a TDM plan that is custom-made for the company, the ACCS has been able to provide 73% of Arlington’s 238,000 employees with basic TDM policies. While all three TMAs have a survey mechanism, Arlington County stands out because of its innovative Mobility Lab. (see here). The Lab conducts annual surveys of residents and employees in Arlington County, reaches out to other TMAs to assemble its own collection of best-practices for TDM, and does related R&D projects of its own. As this entity is both unique and extensive, we hope to submit our work to the Lab so that a wider audience can read our research. Moving Forward We have forwarded our web applet to Adina for her to review and comment on. We are already aware of one glitch with the interface where the pop-up windows for each Caltrain station to not load chronologically. As other glitches, typos, and edits surface, we will be sure to address them immediately before next Wednesday. Additonally, Ma’ayan and Sam plan to finish compiling the telephone interviews and other research into our TDM study paper so that we can submit to Adina and other interested parties by Wednesday. Otherwise, our tasks before the Wednesday presentation are simply to assemble our Powerpoint presentation and rehearse! If we aren’t mistaken, this is the last reflection of the quarter! Sam and Ma’ayan want to take a moment to thank Adina Levin and Friends of Caltrain; Deland Chan, Carly Weis, and the Urban Studies Department; and all of the guest speakers, community contacts, representatives from other TMAs, and others who made this course a successful learning experience. Though this class was a lot of hard work, we are both grateful for having the opportunity to engage in this service learning project! Signing off! Ma’ayan & Sam Descriptive
Last Saturday was a busy, productive, and exhausting day for our group. We had three interviews arranged for the day a various locations in San Francisco. We began the day at Stuart house in the Mission. He was very excited to share his stories with us, and went into great detail about his experience with being bought out of his old apartment in the Mission. He told us about his struggles with the AIDS virus and how that has impacted his experience, and provided us with a unique perspective as he was a tech worker himself that had moved to San Francisco to work for Apple in the 80’s being displaced by a new generation of tech workers. He admitted to being a part of the Mission’s first wave of gentrification, but noted how he had spent many years investing himself in the community that existed there. He was extroverted, excited about our project, and it was an overall great interview. After our interview in Stuart’s house, we made the short drive to our second interview location on 16th street in the Mission. We met with Rick in his office building which was the old Worker’s Temple. He was a photographer who rented out an office space in the building. Melanie from KALW met us there to record us for the project that she is working on. For our final interview of the day we headed to the San Francisco Public Library to meet with Yazmin. After searching for almost half an hour, we were able to secure a quiet study room in the Library to conduct the interview in. Yazmin currently lives in East Oakland and it was incredibly generous of her to be willing to make the trip to San Francisco to meet with us. Yazmin was also very supportive of our project and excited to tell her story. She elaborated on the community she had developed in the Mission since she had moved there in the early 90’s. She was a part of the queer community in the Mission which she referred to as her “chosen family.” She enjoyed being able to run into people she knew throughout the Mission, and mentioned that it felt like a true home. She enjoyed living in a place where people could work jobs that would be enough to pay the rent while being able to pursue poetry, art, and her true passions. Yazmin talked about how she now has to commute to San Francisco for her job, as many people who live in East Oakland do, and talked about how that has limited the community development in East Oakland as people spend so much of their time commuting. We have completed four interviews thus far, and have one scheduled for tomorrow. We originally had a goal of completing ten interviews for the project, but we have begun to realize that ten interviews is a great amount of work to complete in a quarter and have recalibrated our goals. We will complete our fifth interview tomorrow, and view that as a sufficient number for the scope of our project and if we are able to secure any additional interviews we will view that as a bonus. We only have a limited pool of people that provided contact information in the initial survey, and of those people few have gotten back to us. Additionally, we have had several people cancel their scheduled interviews after having second thoughts about the project. We do not view this as a failure on our part, but rather a success in that we were able to accomplish five successful, informative, and powerful interviews. We are looking forward to the next phase of the project in which we will begin mapping our data and displaying the audio and visual component in an attractive way. Interpretive The pervasiveness and immensity of the housing crisis in the Bay Area has become even more clear to us this week. Now that we have begun making regular trips into San Francisco and engaging with residents, the issues we have been learning about through class readings, newspaper articles and lectures are suddenly all around us. One striking experience that epitomizes the ubiquity of this issue occurred last Saturday, after completing our interview with Rick. We were standing outside of his apartment in the Mission in front of a small empanada shop, and overheard a customer saying to the shop owner, “I’m sorry to hear about your eviction.” Curious to know more and wondering if she would be interested in interviewing with us, we inquired further about the woman’s eviction. She told us that she was already in touch with Erin from the Anti-Eviction Mapping Project, but that she had many friends who also had eviction experiences. She gave us her card and told us that she would be happy to put us in contact with them for the purposes of our project. It was such a striking moment for us to simply walk down the street and encounter an entire collection of eviction experiences. It seems that this issue is becoming so pervasive that local politicians have no choice but to acknowledge it. An article published this week in the SF Chronicle reported that State Senator Mark Leno, at the request of SF Mayor Lee, is proposing a bill that would amend the Ellis Act which requires that buyers own a building for five years before evicting tenants using the Ellis Act. Leno stated, "In recent years, speculators have been…[using] a loophole in the Ellis Act to evict longtime residents just to turn a profit...Many of these renters are seniors, disabled people and low-income families with deep roots in their communities and no other local affordable housing options available to them. Our bill gives San Francisco an opportunity to stop the bleeding and save the unique fabric of our city." (http://www.sfgate.com/bayarea/article/2-S-F-lawmakers-push-bills-to-slow-Ellis-Act-5261383.php) While this bill is just a small step towards major reform, the fact that this issue is being recognized by lawmakers and major newspapers is heartening. It makes us hopeful that the work we are engaged in of spreading awareness does have an impact, and does have the potential to reach the people who have power to change legislation in our cities. Applicative Our interviews last weekend have brought about many thoughts and emotions. Hearing Stewart, Rick, and Yasmin’s stories about their connections to their previous homes was telling to how they saw themselves fit into their own communities within San Francisco. What was most eye-opening was the fact that Yasmin no longer felt positive feelings towards San Francisco. She felt rejected and pushed out of a place that she once felt was home. To Yasmin, living in the mission in San Francisco meant living among people she looked up to and admired. When her queer community was displaced from the city, she lost what she loved about the environment the most. No longer would she recognize people walking along the street. She now lives in Oakland, and has no intention of ever moving back to San Francisco. Because of her own displacement in SF, she has become aware of her own actions in Oakland, sensitive to the fact that she may be displacing others. Her mindset has evolved into one that pays close attention to her living situation and its impact on others. Yasmin mentioned that she overheard some people talking about opening a cheese shop in a neighborhood in East Oakland. She said that this disturbed her because she does not want to change the neighborhoods of Oakland the way that people changed her neighborhoods of San Francisco. She made the point that a cheese shop may not be culturally relevant to the population of East Oakland. People should focus on becoming acquainted with and celebrating the unique cultures that are present in East Oakland. Yasmin believes that people should immerse themselves into the heritage of a neighborhood they move to rather than look to reshape the neighborhood in a way they like. These interviews have surfaced thoughts on the eviction process in general. How does a city evolve? Is eviction just one of the many ways a city transforms and, even in extreme cases, overturns? How does culture come about in a city? What factors truly come together to create a neighborhood? Throughout our interviews, a general trend of belonging has been a significant characteristic of a neighborhood. Stewart, Rick, and Yasmin all live/lived in San Francisco for a reason. They all moved to the city for different intentions, but all in all were looking for a place that they belonged. To some, their evictions were seen as a rejection. It is interesting to think that a home is more than just a physical structure, it is what that home represents that is lost when one is evicted. In our group meeting on Wednesday during class, our group discussed that our biggest weakness and area to improve is communication. We have now made it imperative that we respond to each other’s texts and emails promptly, and provide feedback when needed. We also discussed our goals in depth and recognized where the differences were, and where there was a need for re-alignment. Our improvements have been successful! We have implemented more group meetings and predict stronger group communication going forward. |
Archives
November 2020
Categories
All
|
 RSS Feed
