|
Update on Project Activities
This week, we continued working on the final report, presentation, and map. We put together a literature review on Level of Traffic Stress based on the original Mineta study, and we will also created a summary of the other major bikeability metrics. We have also written up the case study on Long Beach and will do so for Copenhagen as well. For the map, we added the intersection analysis from the Mineta study and displayed the results as points. We also tested out ArcGIS Online as an alternative to Carto, and found that it has similar capabilities and is easier to use. What We Observed and Learned The original LTS uses four components to determine intersection comfort. Firstly, signalized intersections are automatically designated as LTS 1. For unsignalized intersections, a score is assigned based on the presence of a median refuge, number of lanes being crossed, and the speed limit of the street being crossed. However, we found that almost all intersections in San Francisco are LTS 1 or 2 based on this approach, because most are signalized or have low speed limits. This scoring is not reflective of the actual stress of many intersections, which lack protection, markings, or bicycle signals. By applying lessons from Long Beach’s intersection treatments (bike boxes, markings, detection signals) and practices we saw in San Francisco (protected intersections), we hope to redo the analysis to better reflect reality. We also tried using ArcGIS online to recreate the map we made using Carto. It turns out that ArcGIS story maps have the ability to create popups, tabs, symbolized lines and intersections, and sidebars. While Carto also has these capabilities, they often require knowledge of Javascript or html. Critical Analysis/Moving Forward Using metrics to gauge a City’s well-being or progress can be tricky business. What works for one study does not always work for another. In the case of the Mineta study, intersection analysis was used for an academic research paper on network connectivity, which requires advanced software and datasets that can be easily analyzed. Meanwhile, the SFMTA uses LTS to help decide on new infrastructure investments, which may require more detailed information about each intersection and what treatments already exist. As we continue improving on our version of LTS, we have to keep in mind that the SFMTA uses LTS for important decisions, and that our LTS should be an accurate reflection of real bicycling conditions. Using Carto also taught us that coding and web design can be powerful planning tools. Interactive online maps can communicate information to the public and other government departments in a clear, engaging format. However, we should keep in mind that maps have also been used to target vulnerable populations. For our project, including metrics like income level and car ownership can help planners understand which neighborhoods might desire more investment in bicycling. At the same time, we must take care to interpret our map in a way that is sensitive to existing residents. For example, some people may view bike lanes as a cause of gentrification, rather than a way to make mobility more affordable. Thus, the socioeconomic aspects of our metric should be viewed with caution. Update on Project Activities
In the past week, we have been coordinating with our community partner, Jonathan, on varying our survey methodology based on his feedback. We are confident and proud to say that we have arrived at a satisfactory final version of the survey. Given that the survey will be conducted on paper, we were able to alter the survey format to allow for several houses data to be recorded on one sheet of paper. Currently, we are working on a training module to accompany the survey. We are also almost done with our written report, funding analysis and presentation preparations. What We Observed and Learned While going through the funding analysis for the Choice grants we realized, that through our observations,The City of Salinas currently has much of the documentation necessary to successfully apply for federal grants to revitalize the Alisal NRSA. Whether the HUD Choice Neighborhoods Implementation Grant will be a viable source of funding however depends on the City and the County’s assessment of the current state of public housing. A specific criteria for the grant application is that a public or assisted housing project within the neighborhood that is severely distressed must be identified to be rehabilitated. Because of the Housing Authority’s active attempts to maintain the state of public housing in Monterey County, most public housing projects are in fair conditions. The more feasible route may be to identify any federally assisted housing projects are in currently in disrepair within the Alisal area. Other eligibility requirements on the conditions of the neighborhood are in fact met as the Alisal suffers from high crime and substandard housing conditions overall. Critical Analysis/Moving Forward Currently our methodology is based on a paper model, requiring volunteers to physically write down their assessments. The data collected is then to be recorded on a map for better visualization. If done by hand on physical maps, then it should not be as time intensive. However, we are aware of the city’s ambitions to map out the data and layer it on top of an already existing GIS database. To achieve this, the survey data will have to be duplicated into an excel form which would cause additional labor; something that may not be as sustainable for the city in later stages of the project. To mitigate this, we will recommend to our partner that they migrate the methodology to a digital platform that is linked to their office’s GIS database, in order to automate a significant chunk of the process. We do understand that there are budgetary constraints that may stymie the transition and as such do believe that the paper survey should suffice for now. We are looking forward to presenting our findings, deliverables and recommendation this coming week and are grateful for an awesome opportunity to partner with The city of Salinas on their community vibrancy plan in the Alisal. Update on Project Activities
After our trip to the GIS center on Wednesday, we realized that we had hit a bit of a snag in our attempts to coordinate on ArcGIS online. Unfortunately, due to miscommunication and mistakes made on ArcGIS’ free trial, we were unable to fully transfer our completed map to a new map file on Stanford’s Esri account. However, we talked with David at the GIS center, and with his help we were able to get Stanford accounts and link them to our free accounts. This means we should be able to keep the content that we’ve made on the free accounts without losing it once the free trial period of ArcGIS online expires. Unfortunately, it did mean a bit of delay with moving our actual project forward. We also started work on the final paper and presentation. With the presentation needing to be somewhat complete by Monday, we are definitely feeling some pressure. However, we plan to meet this weekend to sit down and get some real work done. So far, we’ve completed our outline and literature review, so work is in coming along at a decent pace. We haven’t done much other than an outline for our presentation, however, so that’s the main object of our focus for the next few days. There’s definitely going to be a bit of mad scramble in the waning hours of this project, but it’ll all come together by the end! Had an update with David this week! It’s a bit overdue, but the parks department has been a bit busy addressing flooding issues over the past few weeks. It seems like for now we’re just staying the course, and he’s excited to see our final product next week! What We Observed and Learned We continue to learn more about the GIS services offered by different platforms. ArcGIS posed an interesting dilemma because of the format our data was uploaded in making it impossible to share with other people. This meant that after our 60 day free trials were over no one would be able to access the map. Because of this we transferred over to Stanford accounts and re-uploaded all the data and started to reformat the visualization. After this, we received a BI data visualization format from our community partner David but because we do not have accounts yet we cannot see the data visualization aspect yet. However, this weekend we will download Microsoft BI and see what the “ideal” visualization would look like. Though we don’t have any formal experience with the tool, and it’s doubtful we’ll do anything with it at this point in the project, it will be really interesting to see what the San Mateo County Parks Department could do with the data we’ve collected! For the most part, our “learning” in regards to the data sets is over. Every once and a while, however, we discover a new excel function we can use to better organize the data! Critical Analysis / Moving Forward In terms of the data visualization side of the project, to move forward we need to create accounts in Microsoft’s power BI platform and check out the data visualization provided by David. Following this we will need to decide whether to continue with building our own map or simply converting data for them to add to their platform. While we have been asked to simply convert data at this point, we already have the other data visualization almost done and it could offer an interesting alternative for them given the pros and cons that we figure out about their platform. Because of this new development, we feel that the “data” next steps are to simply compare the new data David has given us, compare it to the work we’ve done, and ask ourselves if we want to make large changes. Moving forward with the presentation and paper: right now, the presentation is the first priority. We’ve started moving forward with the paper, but we have yet to come together and really work on the presentation. Since the presentation is coming up next week, we are meeting this Sunday (and probably Monday morning as well) to crank out at least a good preliminary version of the presentation that we will finalize by Tuesday night. In terms of the research we’ve done for the paper, we have done a lot of background research into the history of the land itself. Luckily, the papers and government documents published by the parks have been generative and thorough, which is beneficial because we can work within the framework of the parks themselves. Some of the issues within the data, therefore, have also come to the surface, such as inconsistencies between the what species are actually there vs what species are said to be there. Some of the species’ special statuses (such as being endangered or not) are also out of date, and in fact the list of species in the area that are under threat was last fully updated in 1986. This has changed some of the framework for paper, as we feel it will be important to comment on the quality of the data itself, and why it may be so (i.e. due to lack of funding, etc.). Update on Project Activities
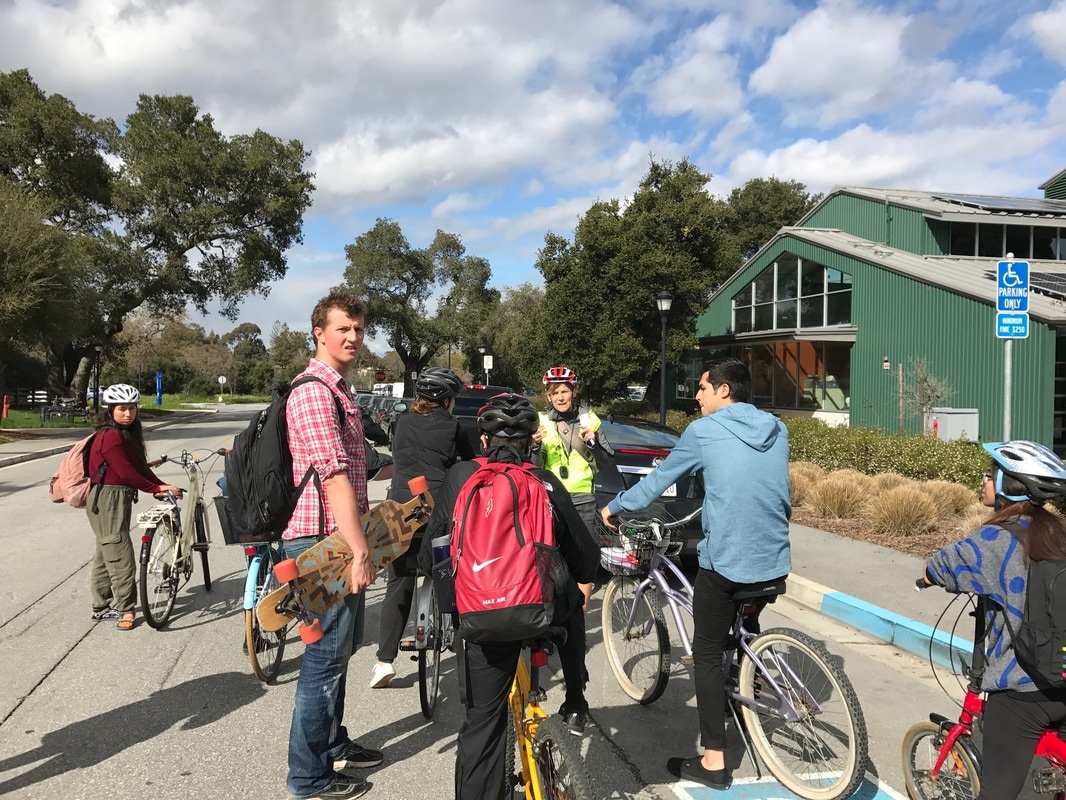
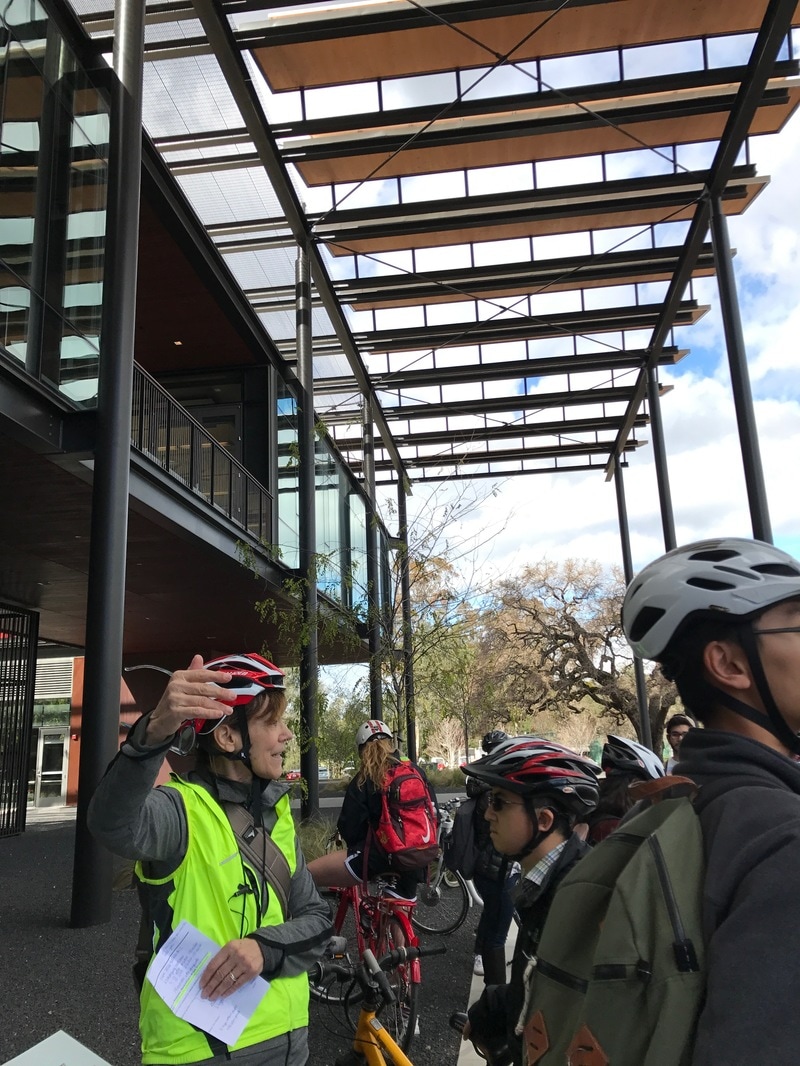
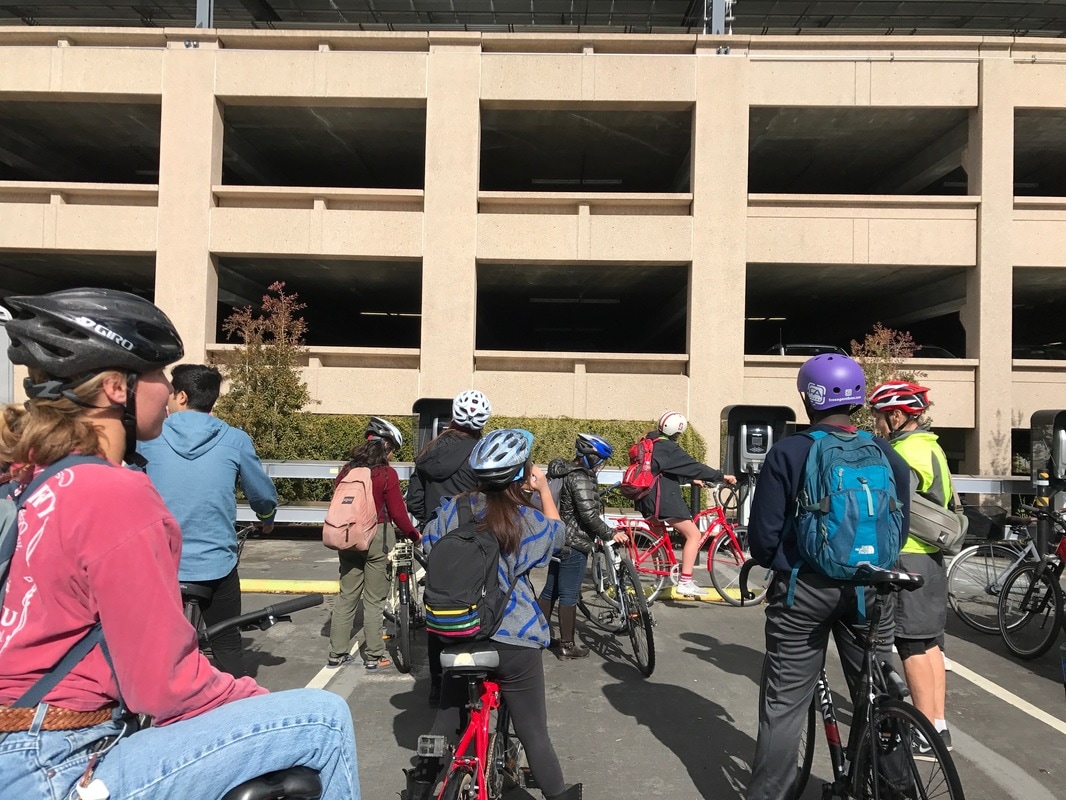
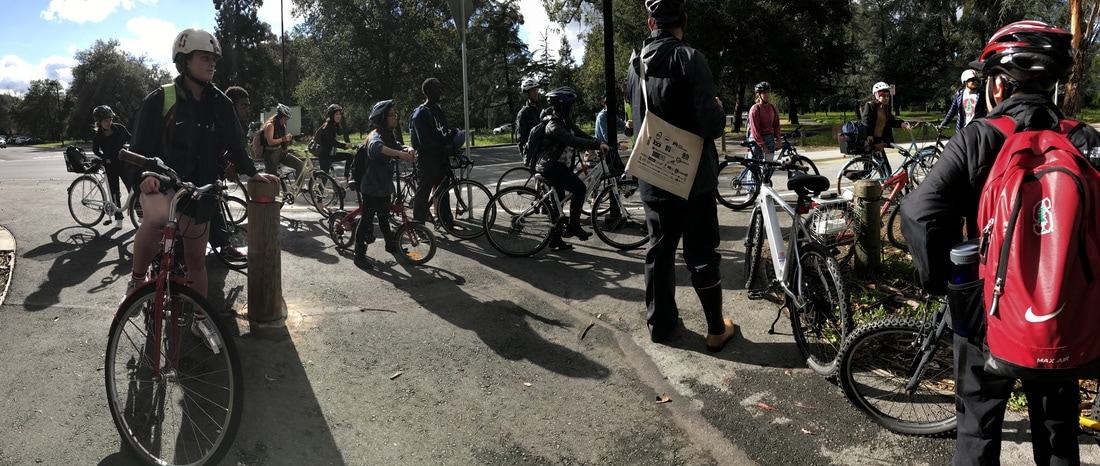
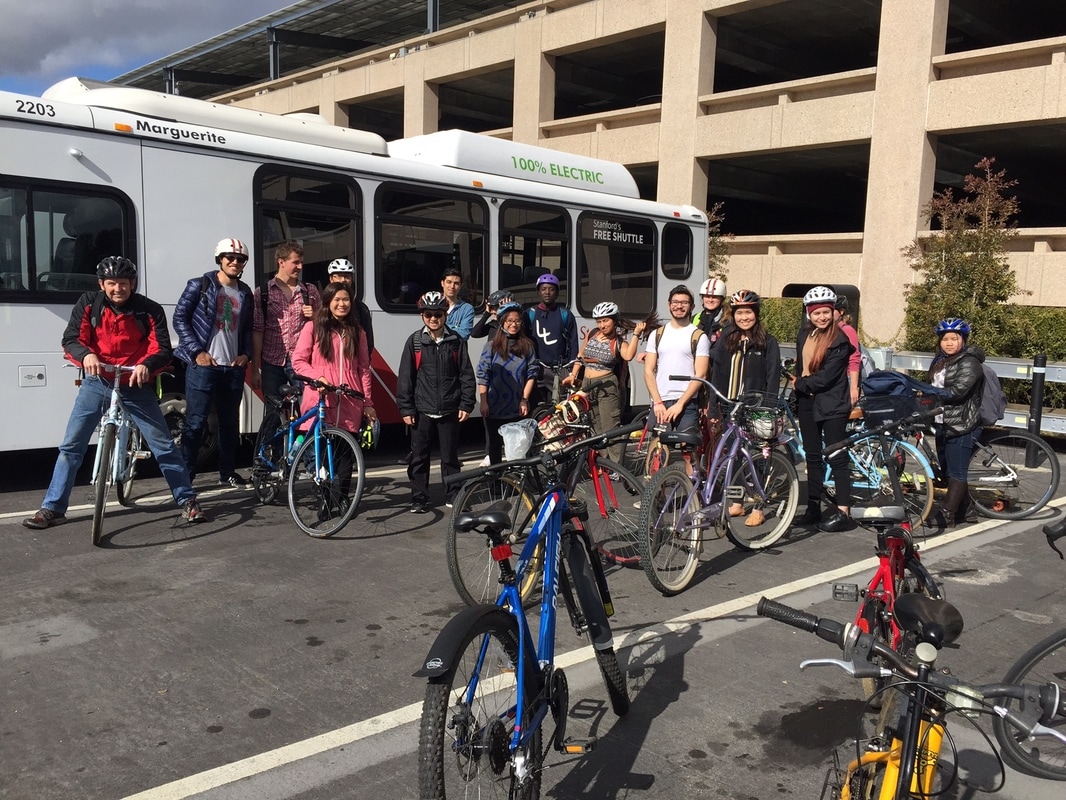
Over the course of this past week, we obtained a significant number of survey responses, primarily due to increased surveying efforts around downtown Redwood City as well as advertisement from Commute.Org. We now have roughly 50 responses (+ some additional transportation feedback from transit industry professionals), although our community partners have expressed some concern over the majority of respondents not being from a low-income background. That said, due to the lack of time, there are no more plans for our to group to do field surveying. Instead, we are now focusing on analyzing the data already in our possession as well as completing a number of deliverables. This past Thursday, a member attended an off-campus meeting with Adina and Chris. There, we went through a number of final check-ins for wrapping up the quarter’s work. Overall, Adina and Chris place high priority on the delivery of the following three items: 1) a thorough analysis of survey responses, 2) an updated survey template, and 3) other resources to help field volunteers collect survey responses. The primary goal of these deliverables is to better inform Friends of Caltrain and Transform of best methods to facilitate a mass survey as well as provide more background research into public opinion around the construction of express lanes. What We Observed and Learned First, we realized the effectiveness of partnering with local business and community organizations. Though it certainly took a long time to get those connections set up, once we did have solid ties with CMTA and Commute.org, we were able to vastly expand the reach of our survey and gain a ton of responses in a very short period of time. Using local community organizations has the advantage of engaging people who are already involved, so they are more likely to fill out a lengthier survey. However, it is important for us to keep in mind who exactly is a part of these organizations and understand the limitations of this approach. It is important to get the opinions of all members of a community, even if it takes extra effort. Thus, even if in-person surveys are time consuming and not particularly efficient, they are crucial in ensuring that our sample mimics the diversity of the Bay Area. Second, throughout our surveying, we have noticed that people in the Bay Area are actually already very familiar with the concept of Express Lanes. We had initially assumed that a knowledge barrier would be the biggest problem with the survey effort, but that was not at all the case. This is because Express Lanes are already being implemented, with many others planned, in many of the other counties in the Bay Area. Highway 237 is the closest Express Lane to 101, so many of the people we surveyed already knew what they were and how they worked. This background knowledge gave us the idea to use the other Express Lanes in the Bay Area as data points for our literature review, on top of perfectly analogous cases built in other place (aka Los Angeles). While projects like the one on 237 don’t use their funds to provide alternative transportation, as the proposed 101 project does, public opinion and research on 237 could prove valuable in assessing and comparing public opinion about Highway 101. Critical Analysis/Moving Forward Our focus for the next two weeks will be to process our data and piece together trends. We’ve heard anecdotes detailing personal frustrations with Highway 101 and are curious to see how survey results help explain support/opposition to HOT lanes. While we have some expectations based on public opinion research behind other express lane projects across the U.S. we aren’t certain to what extent they will share similarities or differences. We are interested in support overall as well as rationale but particularly hope to uncover insights with regard to income level. In sifting through our data and creating deliverables we will identify holes in the current survey and further refine it. In turn we will likely remove certain questions, reword them, or add questions to help clarify linkages. While working through our survey responses we expect our discoveries to drive the direction of our literature searches. Some respondents referenced the highway 237 express lane in Milpitas or the Los Angeles HOT project. It will be important to incorporate the factors that contributed to their effectiveness as a way to align solutions to respondent concerns with proven benefits or disadvantages. While impact reports from other express lane projects will likely be easy to find, understanding what to look for will be the key to efficient analysis. Our work serves as a heuristic towards matching commuter needs and innovative solutions and we predict that our final report will expedite iterations in the coming months. This week, we welcomed Brian and Ariadne from Stanford Parking & Transportation to our class. After a brief introduction to PT&S and their pioneering efforts to implement transportation demand management (TDM), we went on a bike ride around campus to examine recent and planned improvements ranging from infrastructure (e.g., roundabouts and bike lanes) to facilities (e.g., covered bike parking and showers). Thank you both for this informative and fun tour! |
Archives
November 2020
Categories
All
|

 RSS Feed
