|
This week, we welcomed Brian and Ariadne from Stanford Parking & Transportation to our class. After a brief introduction to PT&S and their pioneering efforts to implement transportation demand management (TDM), we went on a bike ride around campus to examine recent and planned improvements ranging from infrastructure (e.g., roundabouts and bike lanes) to facilities (e.g., covered bike parking and showers). Thank you both for this informative and fun tour! 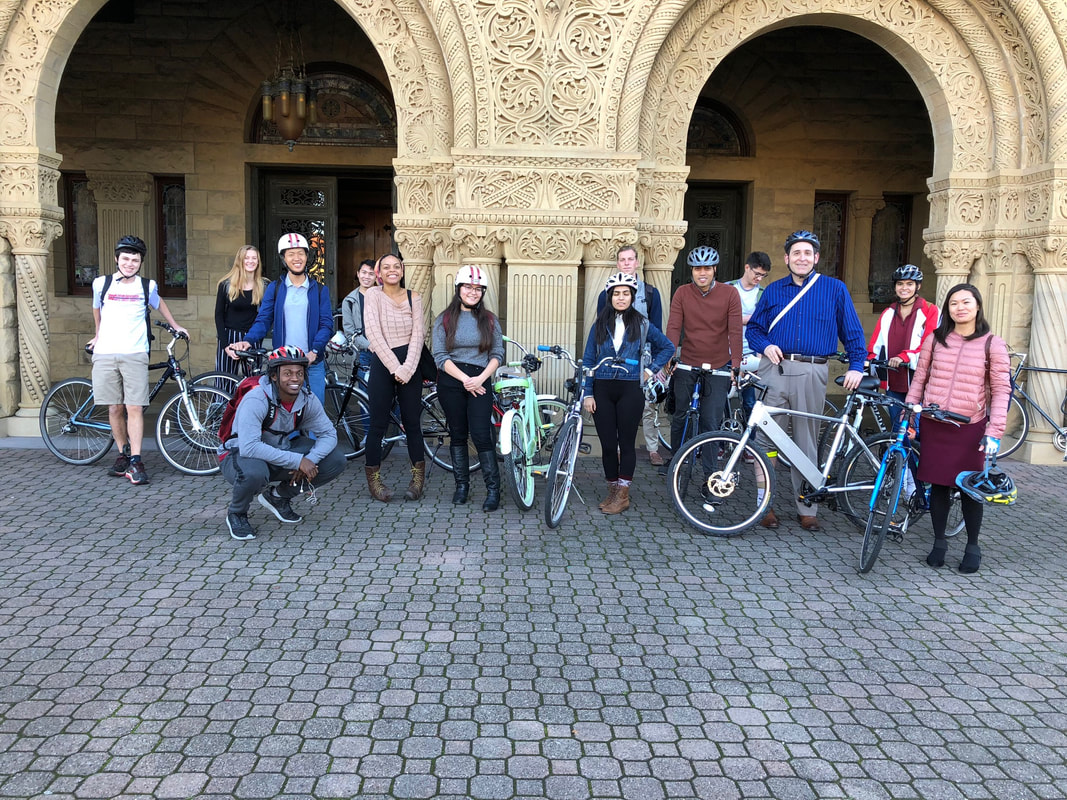 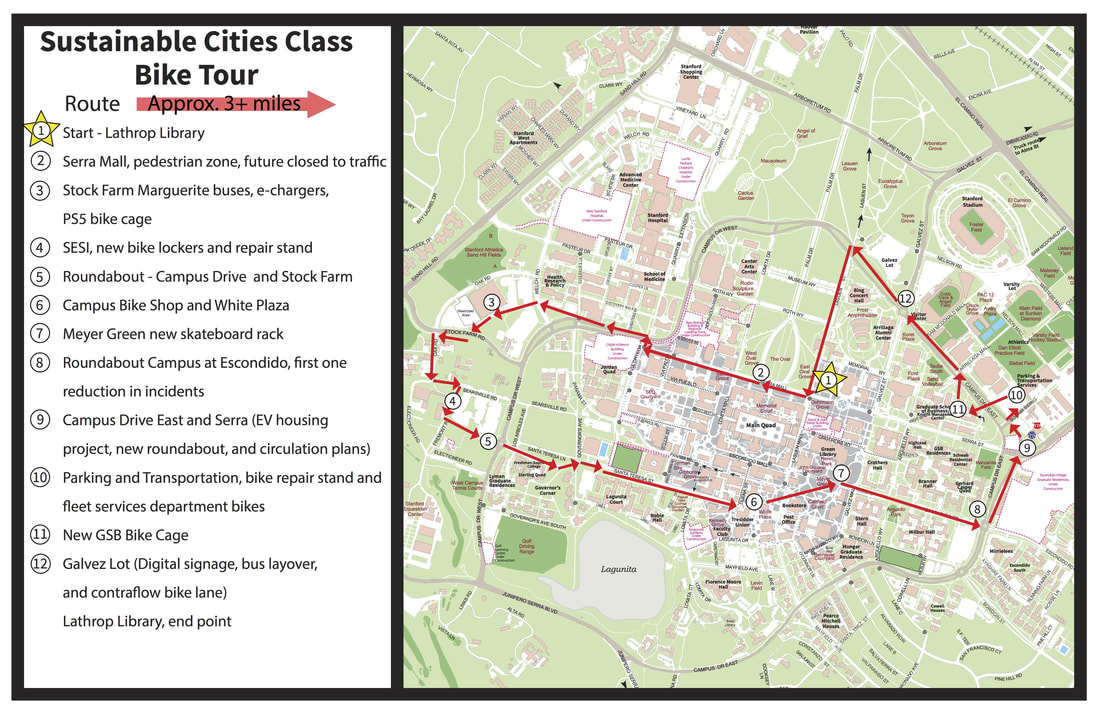 Update on Project Activities
This past Saturday, the Stanford team went to San Francisco for the Strong Homes Campaign Charrette hosted by the Neighborhood Empowerment Network. The objective of the charrette was to brainstorm solutions to different challenges people could face in the face of an earthquake in San Francisco. The event was a key milestone in our participation in the Strong Homes Campaign, as we collected the majority of the data needed for the final compilation of our deliverable, the earthquake resilience toolkit, through the event. Following the charrette, we are now trying to follow the project timeline we prepared earlier this quarter. Our first goal, which we accomplished this week, was to digitize the results, primarily the posters and backyard diagrams designed by the participants, of the charrette and share them with the NEN coordinators Daniel and Neftali. We now intend to get in contact with the NEN team soon in order to reflect on the results and discuss some ideas we may have for the final toolkit. Our biggest takeaway from the event was that literacy in survival techniques, not necessarily physical tools, is the most important asset a neighborhood could have to be well prepared to face a worst-case earthquake scenario. We hope to reflect this finding in our design for the toolkit. What We Observed and Learned Participating in last weekend’s charrette helped our team grow in multiple ways. First, going through the presentation that we gave regarding past disasters really helped us become more comfortable with sharing what we’ve learned to those who are invested in the wellbeing of Bay Area communities. And as we prepare for the expo at the D-School, going through the process of presenting as a team and refining the process of how we prepare our presentations gave us time to look back on our midterm presentation and address the areas that we felt were lacking. Second, interacting with the charrette participants helped us see how passionate community members are about building a more resilient San Francisco. Additionally, Wednesday’s guest speaker helped us better appreciate NEN’s approach in building the toolkit. Our guest lecturer said that when helping people it is best to ‘come with humility and ask questions.’ This is exactly what NEN is doing in preparing this toolkit, and we are excited to be part of a team that is doing it in that way. Critical Analysis/Moving Forward We now run the challenge of making something out of the collection of info we have received, which comes in various formats. We need to digest this diverse set of data and display it in such a way that will be conducive to reaching out to communities and from then on developing the final toolkit. Throughout the data there are focuses on habit forming and supply stocking, as well as multiple considerations such as space, community cohesion, and socio economic differences that may affect recommendations. The most clear cut divisions were advice for pre-disaster awareness and post-disaster survival, with consideration made for the case in which no preparation was made. As we move forward we need to figure out the most intuitive way to condense these different considerations into a single report. This means pulling data from our different means (personal notes, group notes, maps from the mapping exercise) into our report. Our current plan is to read through the data, make a set of organizational categories, code the data through these categories, and finally condense these bits and pieces into a report. We may also want to think of graphic representations that may aid in communicating the results from the charrette. Update on Project Activities
We sent out direct emails to businesses we previously visited in order to remind them about the surveys and ask them to promote to the employee survey, in particular. We also mentioned we will return to Mountain View over the break, so any businesses who would like to talk with us in person can do so. Alex Andrade offered some information regarding the city’s past with regards to housing, and we plan to heavily incorporate this element into our paper and accompanying presentation. Our surveys themselves unfortunately lack relevance right now due to only 34 responses, but we hope to exceed 75 or 100 responses by the end of the break so that we can feel confident making conclusions with our data. What We Observed and Learned After sending many individualized emails to business owners in Mountain View, we learned that many do not even employ minimum wage workers. Despite Alex’s news that one tech job creates five service sector jobs, we did not receive information about these employees from big name companies in Mountain View. We will either need to change our approach with these companies or focus on the smaller businesses where almost, if not all, employees work for minimum wage. During the Salinas presentation in class, we noted many useful tips on how to interact with and present to another community. First of all, we realized we need more pictures of Mountain View’s business layout and (if allowed) workforce so that city managers understand the stakeholders in the minimum wage situation and what they bring to the city. We also decided we should highlight direct quotes from workers and business owners in our presentation and paper in order to make our work more relatable and in order to let the citizens of Mountain View, rather than a group of outsiders from Stanford, explain the circumstances they face daily. Critical Analysis/Moving Forward Since our entire team will stay on campus over the break, we plan to dedicate our time to finishing our surveys, meeting two more times with workers and business representatives in Mountain View, and drafting our final deliverables. We will plan our visits around Thanksgiving and go during morning hours in order to increase the probability that business representatives and employees can make time to speak with us. Throughout the week we will also make a final push with the ongoing online surveys on social media, email and any other outlets we can find. We must greatly expand our results before the end of the break or we will not obtain an accurate representation of the city’s thoughts on both sides of the minimum wage ordinance. We will also try to meet with Alex again in order to establish a specific timeline for presenting to the Mountain View city council. We will also verify his expectations for our paper so that we can put our best feet forward when we begin drafting over the break. We will make sure to use our voices not to tell Mountain View what to do but rather to offer the city council enough evidence to make its own conclusions. Finally, we will focus our break on taking pictures and gathering direct quotes from citizens affected by the minimum wage ordinance so that their stories speak for themselves. Literature review on other high-minimum-wage cities should help us in making comparisons and projections for Mountain View’s future. This week, we performed one more interview over the phone, analyzed the interview from the previous week, and came up with a plan for the next few weeks. We also were able to compensate for last week by finishing the Instagram writeup for our social media package.
On Monday, we conducted a phone interview with Ms. Thwaite, a middle school teacher in Menlo Park. Ms. Thwaite talked to us about her experience with the challenge and some of her concerns moving forward. One thing she mentioned was that she was unsure of the long term effects that the challenge had on the students. While they were motivated by prizes, she suggested that the kids probably would not continue “green actions” unless they felt emotionally connected to and moved by the plight of climate change. Another good piece of feedback that we were given was that it was pretty difficult to fit the challenge into the core curriculum. Her students had an ecology section where they watched An Inconvenient Truth, but it was difficult to motivate students outside of that particular section. One particularly useful suggestion was to look at each grade’s core requirements individually and come up with lesson plans that could be implemented for all three middle school grades at the same time. This would bolster the program and allow for more friendly competition and education amongst students. Like Mr. Powell, Ms. Thwaite emphasized that getting recognition for actions was a rewarding prize for kids. In addition, Ms. Thwaite continued to bring up the need for more internal motivation from the students. While prizes were fun, they did not necessarily result in long term behavioral change. Thus, we brainstormed together some ideas to get kids more motivated about climate change in general. One idea was to watch videos that motivated kids to do projects for their school. One year, students realized after watching a video on waste, that the paper trays used for lunch were incredibly wasteful and launched a campaign to lower the use of paper trays at their school dramatically. So, in essence, giving students the agency to decide how they will act and how they will make take action is very empowering and lead to a significant action. This is information we hope to use in developing our student project package. Through our Instagram social media research, we found two successful profiles related to environmental consciousness (Charity Water and General Electric) and analyzed their feed aesthetic and content to provide examples of Instagram engagement for Menlo Spark. A portion of our research related to feed appearance and photo quality. According to a study by Curalate, blue photos or photos with a higher proportion of background received more likes than reddish or multicolor photos. Photos that are more well lit and have a higher proportion of background space are also more favorable. We found all these techniques employed in both Charity Water and General Electric’s feeds. Instagram allows up to 2,200 characters per caption, or about 400 words total - however, shorter captions that have very clear intent and impact are more effective than longer ones. For example, Charity Water’s captions are extremely concise, corresponds with the images and showcases examples of how their cause affects individuals in developing countries. General Electric’s captions tend to be longer, which is perfectly acceptable as long as each sentence is written with intention and the captions are not too verbose or utilize complicated sentence structure and vocabulary. We then applied these principles to Menlo Spark’s current Instagram page and provided suggestions. Their feed is very white because the majority of the pictures are screenshots, meaning that they blend into Instagram’s white background and also blend into each other. This creates a lack of contrast and visual interest between images, and it is highly recommended that the posts do not have a white background in order to bring color into the feed. Many of their posts consist of pie graphs and charts, rather than showcasing an image related to the information (i.e. a picture of someone driving their car for a transportation emission statistic). Too much text in the images themselves detracts from the feed’s appearance, and because it is unlikely that users will want to analyze a pie chart and have to draw their own conclusions, they will skip over the post instead. Moving forward, we plan to use the information from both interviews to complete our student package and campaign strategy over the next two weeks. We are doing well on the social media and website suggestions, but will continue to work on integrating the green challenge into the core curriculum of various grade levels, creating lesson plans, and ways for students to be more engaged. Assessing Future Housing and Transportation Patterns in the City of Palo Alto | Week 8 Reflection11/17/2017
Current Progress
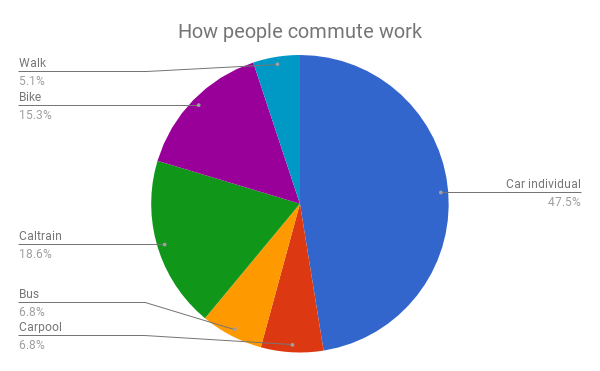
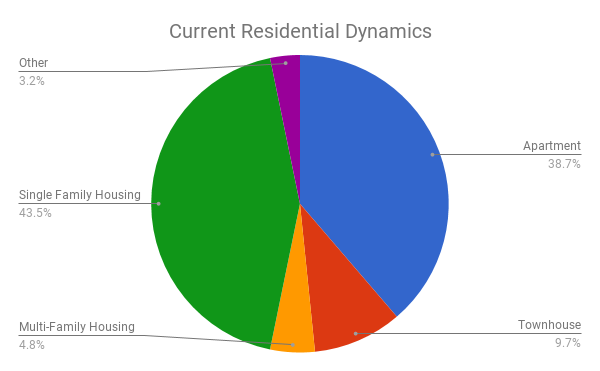
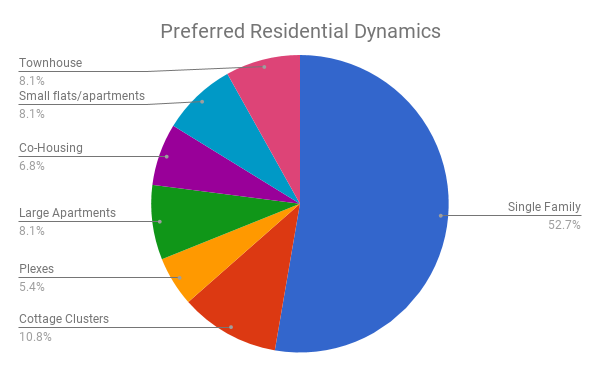
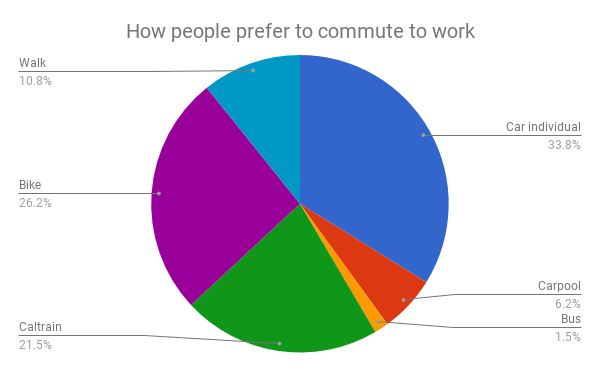
This week, our team finalized the analysis concerning paper survey data and are proceeding to write a comprehensive paper. For instance, out of the 50 ranking responses, 86 percent of individuals prioritized housing cost as one of their top three consideration when owning a home. However, we received zero positive comments on the housing market in Palo Alto, and overall, housing quality was ranked at around 19/100. Out of the 24 written comments, 13 of them were about housing being too expensive, and the rest were concerning transportation. This is definitely the most significant aspect of our research project. We are hoping to frame our final paper more towards housing than transportation due to the significance of collected data. People seem to prefer closely knit, cheaper neighborhoods with access to public spaces and commercial entities. For example, 93% of people mentioned that grocery stores were absolutely essential near their place of residence. This was followed by 67% need for open spaces, and 60% for restaurants. This does not mean they would prefer smaller, apartment type homes compared to single family homes. The citizens of Palo Alto want to vitalize more sustainable forms of transportation. This includes commuting via buses, trains, walking and biking rather than driving. Our survey found that 48% of employees drive to work whereas only 34% of them would prefer to drive (See figure 1). People would rather bike or walk to work. This preference is largely dependent on an individual’s proximity to work, and the walkability/bikeability of a city. Since locals and employees rated biking and walking in Palo Alto as 77/100 as compared to a 47/100 for driving, the distance is likely the limiting factor. Palo Alto is one of the most expensive cities in California to live in. More than two-thirds of Palo Alto’s employed individuals, which is twice the local population, live outside of the city limits. Very few individuals take advantage of the local bus systems. Roughly 7% of employees take a bus to work, and only 1.5% of all employees claimed it was their prefered form of commuting. The quality of the bus transit system was ranked around 50/100 due to a variety of factors. Many people said the bus system is too infrequent and doesn’t make its routes and times as readily accessible as the Caltrain. With the uncertainty in the bus system, people can’t afford to use it as a reliable means of getting to work everyday. When asked what people valued in bus transit, frequency, network connectivity, and overall driving range were all between 70-82/100. A more reliable and connected bus transit system could shift commuters away from automobiles. In preparation for our deliverables, our group began a side project entitled, Faces of Palo Alto. Based on the one on one interviews, we designed personal vignettes that are meant to represent the average citizen’s daily routines and concerns. Many of our stakeholders and speakers this quarter have addressed the need for a human element, or personal aspect in social justice projects. Asking why the average citizen would be interested in our work is essential. We believe that Face of Palo Alto will compliment the final research paper. Our group completed the first draft of our final paper. Our stakeholders requested a blend of an op-ed piece and a research paper. As a result, we have developed a research story with an exposition, methods, results, and a discussion section. We are currently waiting on feedback to improve the draft and begin working on our final presentation. We have also created a Google Maps document that shows the initial and final points of respondents’ commutes. Plans: As the online survey accumulates, our groups will being to finalize our figures and conclusions for our presentation. We just sent a rough draft paper to our stakeholders and are awaiting comments. We plan on meeting our stakeholders one last time after break to discuss our findings and paper before the presentation Lastly, our team is designing slides and meeting at least twice to rehearse our presentation for the December 6 conference. Issues and Discussion: We believe that the housing problem in Palo Alto has a simple solution: design cheaper, smaller, and denser housing units to reduce commute times and alleviate cost burdens. But like any social/economic planning project, and very much like the SF housing issue, initiating these housing projects will not be that simple. The citizens have expressed their interest in reducing costs, but also want larger, single family homes. The systemic issue is a belief that the ultimate residential goal in life is a large, single family home. This idea has to be shattered in the next few years for housing to thrive not only in Palo Alto, but the Bay Area as a whole. This is a classic tragedy of the commons mind set. People recognize their is a problem, but their own self interests outweigh the long term externalities. Based on our readings and interviews, we believe the elderly population will either suffer at the hands of increasing housing prices (being forced out in time), our continue to exacerbate the housing crisis by living the rest of their lives, in low taxed, protected housing. As for transportation, some people expressed a need for more predictable, frequent transportation regarding both buses and Caltrains. They would be more willing to take public transportation rather than automobiles if they knew they could get from home to work in a predictable, short amount of time. However, the majority of drivers refuse to give up the reliability of a car. Just due to their mobile lifestyle and need to visit sites for leisure rather than necessity, they will rarely use public transportation. Hopefully, as public transportation networks unify in the Bay Area, people will be more willing to take the extra time to travel via sustainable outlets to their destinations. All improvements to public transportation should ultimately lower congestion rates and raise the driving scores in Palo Alto. The hardest part of any research project is making the leap from analysis to implementation. We can observe and point out the issues, but ultimately, the policy makers and hopefully the citizens, will begin to push for real housing and transportation reform. |
Archives
November 2020
Categories
All
|
 RSS Feed
