|
Update on Project Activities
We are currently in the last steps of our data analysis. It has been very exciting and interesting to see conclusions come out of the survey data. Each team member is continuing to work on the aspects of data analysis that we originally decided on: Katherine, Andea, and Brian are focusing on the quantitative aspects of the data from the survey with respect to different demographics while Jessica is doing geographical analysis using GIS and Steven is doing analysis on the qualitative data from the survey. For the most part, we just need to finish processing the additional survey responses in order to update our existing graphs. This week, we met with Derek to discuss our data analysis. Each team member showed Derek what analyses we had performed on the data. He gave us feedback on what could be improved and what further steps could be taken to provide a more complete report. Derek’s input will be valuable as we make important decisions regarding which data interpretations will be included in our final report and what suggestions we will make for further steps regarding East Palo Alto’s concern and awareness of climate change issues based on the data interpretation. As we finish up our data analysis, we are starting to turn our attention to working on the final report and presentation. We are planning to make as much progress as possible on the final report over Thanksgiving break so that we can maximize the time we have to proofread/edit the final report and prepare for our presentation. We are also in the process of deciding how we want to structure our presentation; we will have a better idea of how to structure the presentation once we have our final report laid out. What We Observed and Learned In class this week, we discussed smart cities and also attended the Environmental Justice Symposium. The Environmental Justice Symposium was a nice way to tie together the themes of the class and the projects we’ve been working on. It is useful to look at our project through the lens of environmental justice as one of the main goals of our project is to reduce the environmental burdens on the citizens of East Palo Alto as much as possible. Critical Analysis/Moving Forward Looking back on our project, there are a few things we could’ve done differently that would have made us more productive and efficient. For one, we felt that we should have communicated more extensively with our community partners in the early stages of the project to get a better sense of the work we were responsible for and the expected timeline. At the outset of our project, we had a sense that the majority of our work would focus on data analysis of the existing survey responses. We did not realize that there was still a fair amount of surveying to be done, and we could have devoted more of our time and effort towards attending survey events in order to get an adequate amount of survey responses more quickly. Although we did not design the survey, we consistently regretted not including certain questions on the survey which could have added new insights to our data analysis. For example, we were curious as to the education levels of our respondents, but the survey lacked a question which addressed this. One of the most difficult parts of surveying is the fact that we couldn’t go back in time to ask respondents additional questions. As a result, we felt somewhat limited by the data analyses we were able to perform with the existing survey responses. It was also difficult to utilize surveys which were only partially filled out. Our thinking about sustainability and community-based work began to shift when we realized that our project was about more than just analyzing surveying data. The data and the analyses we perform will help to guide the community’s decision-making process in addressing problems related to climate change, and more specifically the risk of flooding in Palo Alto. We are glad to know that our analysis will have concrete real-world application and hopefully benefit the future of East Palo Alto. Update on Project Activities
This week our team has been working diligently to continue our data analysis and begin drafting up our final report. We’ve assigned specific data responsibilities and sections of the final report to each team member and have been doing a pretty good job keeping everyone accountable. Katherine, Andea, and Brian are taking the lead on the quantitative data analysis using excel, stata, and tableau. For every demographic, Katherine is creating pie charts and tables that will show response frequencies and the results from different data analysis tests. Andea is working on Tableau to create bar graph visualizations representing different survey questions disaggregated by race, gender, homeownership status, age, and employment status. Brian is also compiling pie charts for all survey respondents in regard to questions about climate change concern and awareness. Steven is taking the lead on analyzing the qualitative data from the survey which mainly consist of text answers to open-ended questions. He’s developed a python script that will parse out the most commonly used words and phrases in the responses and representing the responses in a bar graph. He’s also developed a word cloud representation of the responses that is both insightful and aesthetically pleasing. Jessica is working on a spatial analysis of the survey data using GIS. She has so far been able to match survey addresses to East Palo Alto parcels and map out the geographic distribution of survey respondents across EPA. She has had the support of Derek in obtaining GIS data such as parcels, EPA boundary map, and FEMA flood zone area. Her first GIS analysis was to map responses to the survey question, “Is your property in a FEMA Special Flood Hazard Area?” and contrast the answers to the actual flood zone. Through this analysis we found that a good amount of people living in a FEMA flood zone are aware of it, but there are also a handful that are not. In terms of the final report, Jessica and Katherine have started drafting up the background information and introduction as well as methodology. Brian and Steven will be in charge of the literature review and they have already found a few useful sources from Derek’s previous projects. What We Observed and Learned This week in class we have been learning about transportation systems in the Bay Area and Stanford’s own transportation demand management system. We got to take a bike tour around the campus to visit different bike infrastructure as well as the Marguerite bus lot. It was really cool to see Stanford incorporating climate-friendly transportation (via electric Marguerite busses), but it reminded us that East Palo Alto is largely lacking in sustainable transportation infrastructure in comparison. We were reminded of the importance of our work in encouraging policymakers to bring similar changes to East Palo Alto. Critical Analysis/Moving Forward The next week is expected to be as productive, if not more productive than this week. Data analysis is expected to be finished, as well as the methodology section of our final report. Something that we’ve already begun discussing is how we want the layout of the graphs/tables/pie charts to be on the final report, but by next week we are hoping to finalize a template with which to input our data analyses and begin our interpretation on. By the end of next week, we want to have made significant progress in our report, and make leeway on our final one-page deliverable for the East Palo Alto residents. As it has already been stated, data analysis is still to be completed, however, there are some findings that should be brought to attention. Current GIS mapping shows that residents aren’t completely sure whether they do or not not reside in a flood zone area. For those that do know that they reside in a flood zone area, they aren’t completely sure whether they do or do not have flood insurance. Analysis concerning concern shows that overall, most residents are concerned about climate change yet they aren’t well versed in the topic. After being presented with related information, initial concern changes, areas that aren’t climate change related show a drop in concern while concern regarding climate change increases. Our findings presented in our final report will show the relationship that exists between the residents of the East Palo Alto area and their concerns as well as current risks due to ongoing climate change. These relationships will be combined with the thoughts of the community in order for one to be able to fully understand what the statistics mean given the context of the community. This understanding will allow decision makers to know where to direct and focus their attention and efforts to in order to effectively initiate actions to combat climate change and engage the community. Combining statistics and thoughts allows for our report to truly be the voice of the community and is why a one-page deliverable as well as a thorough and robust report is being created. The one-page deliverable allows the team to concisely present all findings but more importantly, it allows the team to inform the East Palo Alto community where the community as a whole stands. Also, it allows those who participated in the surveying phase of the project to directly see how their contribution helped shape the end result. Update on project activities
This week was a huge success for our team. On Monday, Katherine picked up ~65 surveys that Violet had collected at Saint Marks this weekend, and each team member was given a portion of those to digitize. As was mentioned in our reflection from last week, we met with Derek, Violet and Deland on Wednesday to check-in about our progress regarding surveying, digitizing and initial data analysis. After both this meeting and a Wednesday night team meeting, we officially finished surveying and digitizing surveys and are now beginning to focus all of our efforts on data interpretation so that we can begin the report shortly. We have ~314 surveys total! What we learned and observed Our plan for data analysis has changed drastically since last week -- and for the better. During our meeting with Derek, he recommended we make our analysis process more efficient by having more ‘horizontal’ analysis roles rather than ‘vertical’. Our team had previously been under the impression we should each tackle a different demographic and compare it to the survey results/climate concern, however with this new ‘horizontal’ analysis strategy each member now gets to work with each demographic, performing a specific analysis practice to each one. This strategy turned out to be incredibly helpful for our team, and allowed us to dive into things we are all interested in: for example, Andea, Brian and Katherine all are going to run their own quantitative analysis tests on the data (Andea using python, Brian using graphs, and Katherine using statistical analysis tools to find correlation coefficients and p-values) while Jessica and Steven were able to focus their efforts on the more qualitative data analysis work (categorizing short answer responses, creating word clouds), as they preferred. We discussed many other topics during our meeting with Derek, Violet and Deland. Our team discussed potential drawbacks to the survey as it currently stands, and plan to write down our thoughts on the “recommendations” section of our report. Some examples of setbacks to our survey as it currently stands are:
The team realized a lot this week; mostly, we were reminded of the importance of having a strict plan with clearly established roles for each team member. We all want to participate equally, and with open communication and mutual understanding we were able to achieve this and more this week. Critical analysis and moving forward Derek emphasized the importance of setting deadlines for ourselves in advance of due dates so that each member can engage in ‘quality control’ with each other’s work. As such, by the end of next week, our team is hoping to be done with the data analysis for every demographic ( gender and climate concern in EPA, age and climate concern in EPA, etc.) so that the data interpretation process can begin and we can focus all our efforts on creating the report. The Interpretation Process Each team member will be responsible for interpreting the results of the data analysis for one/two demographic characteristics and climate change concern. This interpretation involves drawing conclusions and discussing patterns. We plan on referring to pre-existing literature to explain why we may have observed what we did for different demographics. As we all originally decided:
In addition to finishing our data collection and beginning data interpretation, our team is hoping to begin outlining the sections of our report that don’t depend on data (the background section, for example). In addition to the report we’re going to make, we’ve decided to create a one-page summary of our findings and recommendations (containing graphs) for the residents of East Palo Alto to read and keep. 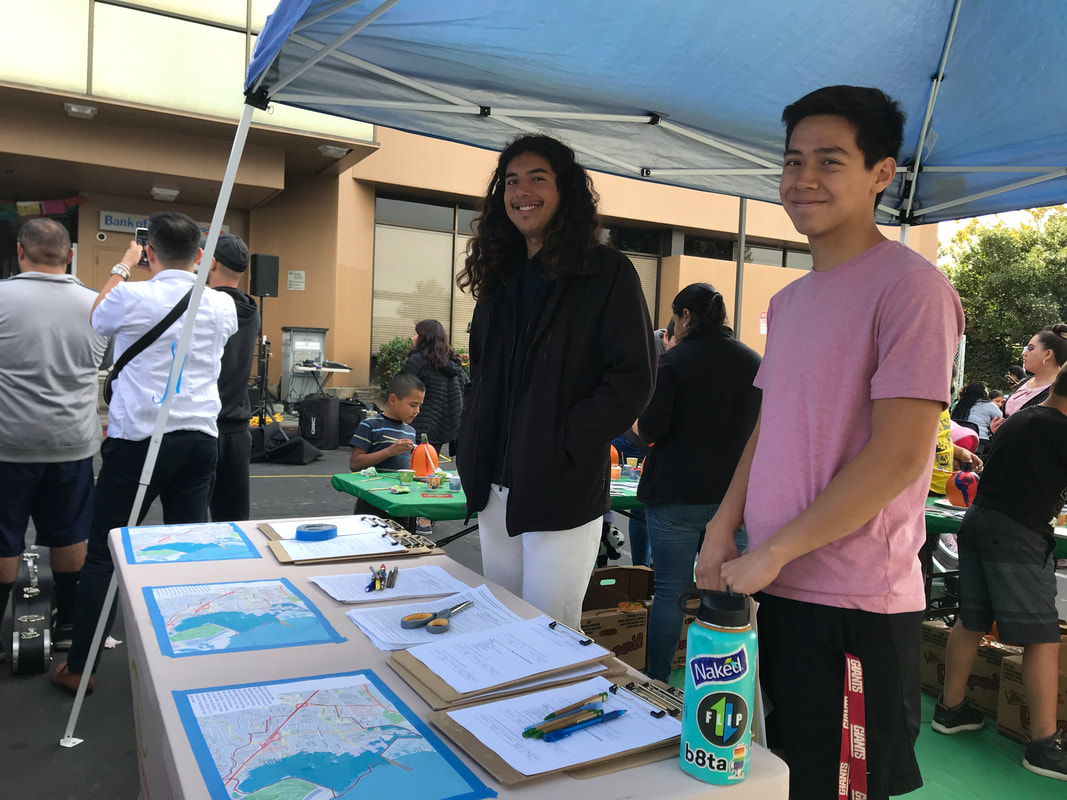 Update on Project Activities
During the past two weeks our team has been doing survey work in the field at various community events. On Thursday afternoons we’ve been working at a food distribution event at the Mouton Center, and last Saturday we worked at the Latinx festival at the East Palo Alto Library. We have been fortunate and grateful that the Acterra team has taken on the digital inputting of the paper surveys, so we have been updating our spreadsheets with the new data. The key data points that we wish to investigate are climate change awareness in relation to age, ethnicity, and response language. What We Observed and Learned The opportunity to do surveying fieldwork has been a really valuable learning experience for our team. I think we all realized that surveying is much harder than it seems and now further appreciate the time and efforts it has taken just to gather the existing data we have so far. The biggest challenge in surveying is asking people for their time. The survey is rather long and involved and it is an inconvenience for people to sit down and take it. Furthermore, we have realized the importance of language in connecting with people and helping them feel comfortable. For example, on Saturday we were surveying at the Latinx festival and many of the people there were Spanish speakers. Brian is the only native Spanish speaker among our group and he was able to talk to residents and persuade them to take the survey much more easily than Steven and I could. I pushed myself to try speaking Spanish and had limited success. I think it does help people feel comfortable and trust you when you approach them in their own language. Throughout the surveying process we have been continually changing and adapting the survey to improve it. We received feedback from the climate change community team that community members are more comfortable with using paper surveys because of unfamiliarity or distrust of technology, so we have transitioned to paper surveys at all our events. We have made note of specific areas in the survey that often get skipped and make sure to double-check that respondents fill out those sections. We also observed a need for Chinese translation in the survey materials, specifically with the group of people who attend the food distribution event. The main takeaway from our survey work is that it requires patience, community awareness, and meticulous double-checking. If a certain part of the survey is not completed, that could render the data unusable. As a result, we’ve also had to spend a good amount of time bothering people to come back and fill out the survey correctly. Critical Analysis and Moving Forward This weekend, we will be attending the adaptation planning meeting with East Palo Alto community groups and surveying at another food distribution event. This will be one of the last survey opportunities and we hope to make significant progress on our goal of 400 responses. We have a plan for how to proceed with the data analysis, and we hope to jump right in next week and begin spatial analysis by coding the survey addresses into GIS format through georeferencing. We will also work in Excel to sort through the survey data and find relationships between climate change awareness and age, location, and ethnicity. We will have to make decisions about which awareness metrics to use for this. We will need to check in with Derek again in the next few weeks to get a little more guidance and direction for the data analysis. Looking forward, we should continue to keep the principles of ethical and participatory research in mind, prioritizing the needs of the community in our work. This week's Wednesday class about zoning laws and CEQA was very applicable when thinking about East Palo Alto and I think we should definitely keep these considerations in mind in our work. Just being in the space, we can observe how city planning might have failed the needs of residents. For example, university avenue runs right through the city and the road is extremely busy and congested during traffic hours. We even observed signs in residential neighborhoods that said "no commuter traffic 4pm-7pm" because I imagine commuters would try to drive through residential side streets to get around traffic. This is definitely a huge environmental quality issue for East Palo residents, and although this is outside the immediate scope of our project, I wonder what work we can do around this issue. Update on Project Activities
This week, we continued digitizing the remaining paper surveys, began and finished cleaning up the data, and checked in with Violet. The digitizing process wasn’t as straightforward as we initially thought it would be for there were some problems with the surveys themselves as well as with the language some of the surveys were filled out in. The cleaning up of data has removed what isn’t essential and will make future analysis easier. The meeting with Violet was a digital one where the project and its aspects were discussed. What We Observed and Learned As the paper surveys were being digitized, we found that some weren’t completed correctly, typically this was because a survey wasn’t completely filled out or directions weren’t properly followed. This led to us not being able to digitize these surveys though KoBoToolbox, the online platform that we are using to collect survey responses for KoBoToolbox will only process a survey if it is filled out correctly. However, since the data from KoBoToolbox is being exported to a Google Sheet for data analysis purposes, the information that we were unable to upload through KoBToolbox was directly written onto the Google Sheet for it might prove to be valuable in the future. There were some forms that were filled out in Tongan and Samoan, languages that nobody on the team knows how to read, however we will seek out someone who does so that we can properly digitize them. While going through the data on the Google sheet, some survey entries had to be deleted because they were either a test response (a response to evaluate whether or not the survey was working properly) or were a duplicate. Information was standardized so that if certain aspects of the data, such as addresses later needed to be plugged into a GIS mapping tool, there wouldn’t be any problems regarding formatting. Besides this, irrelevant information that was imported onto the Google Sheet due to the way KoBoToolbox encodes its exported data was removed so that the data is easier to understand. In our digital meeting with Violet, she went into more depth explaining the survey’s purpose and the team’s role. She explained that the survey was created in order to understand the level of community awareness regarding climate change. By knowing current awareness and levels of concern, action planners will be able to determine what courses of action to take for they will know what needs to be prioritized. The team’s role is to help action planners reach the state where they can effectively begin to make informed decisions. In order for this final state to be reached, the team will present the current awareness and levels of concern as well as other findings from the survey, such as concentrations of concern, specific racial breakdowns, and how language plays a role in the larger picture. Critical Analysis/Moving Forward Although specific examples of what can be presented to the action planners was included in the final paragraph of the last section, those were only some possibilities that were discussed and it is unclear as to whether or not such information will help the action planners. For this reason, a list of of potential pathways (listed below) for the data was given to Violet so that she can discuss the possibilities with the action planners on a meeting that is happening on the 14th of this month, doing so will allow for the team to take a more guided approach to the data. This meeting will be attended by the team in order to listen to what is being discussed as well as to get to meet the action planners. -Relationship between climate change awareness/community concern and age -Relationship between climate change awareness/community concern and gender -Relationship between climate change awareness/community concern and race/ethnicity -Relationship between climate change awareness/community concern and location -Relationship between climate change awareness/community concern and response language -Relationship between response to “What comes to mind when you hear the term ‘climate change?’” and response to “How much do you think climate change will harm the East Palo Alto community?” (gauge relationship between knowledge and concern) Besides this meeting, there are two EPA Adaptation Planning Meetings, one on the 25th and the other on the 26th of this month that will also be attended by the team in order to further discuss the project and how work has progressed. Survey collections will continue until the end of this month. Collections will mainly be done by other organizations but there are existing opportunities for the team to help in the collection process. One of these opportunities in on the 12th of this month and the other is on the 17th. Who will be able to go from the team is currently being figured out. |
Archives
November 2020
Categories
All
|
 RSS Feed
