|
Update on Project Activities
Over the course of the last week, we met with both Deland and our community partners to update them on our progress and gain their guidance on the form of our final deliverable. We shared the findings of our data analysis and received positive feedback about the new direction we have taken our project in. During our meeting with Deland, we discussed our final deliverables and agreed upon making a website to showcase all of our work (data, code, final report, executive summary, and story maps). We also divided the final project work up amongst our group. AJ and Lilla will work on analyzing Muni and VTA transit data with our code to provide recommendations about scheduling. Along with Ken, they will transfer this data into ArcGIS and create visualizations via StoryMaps to show how the inconsistency in transfer times is affecting communities differently. Ken and Brandon have been working on building out the website to present all of our work in a visually compelling and accessible way. Allan has been leading the literature review and background/contextual information for the final report. More specifically, work on the website—hosted by Weebly—began this week as a medium to display the work we have completed this quarter. The intention is to display the driving guidelines, background, methodology, findings, and recommendations stemming from our project. The layout of the home page has been completed. Visitors to the page are greeted with a scene at Millbrae Station, then provided with a link to our background along with the Grand Jury Report as well as the definition of the MTC’s Communities of Concern. Next is a link to our process and methodology, which has yet to be completed, followed by a space for us to clearly lay out our results and recommendations. We have also started drafting our final report. Currently, we have our project description literature review, sections on background and context, bios about our community partners, and a comprehensive outline that we are slowly filling in. Once we have visualized our scheduling data, we will be able to type up formal recommendations and write an analysis on Caltrain access barriers that will make up the majority of the report. In our meeting with our community partners, Adina and Ian, we were able to discuss how our new data could be most useful to them. Just by looking at the spreadsheets, it was clear to them that our data went beyond what the Grand Jury report had summarized. Ian pointed out the huge variations in transfer times and suggested some ways to visualize our data, as the spreadsheet format isn’t very approachable (though we will upload everything onto our website). He also proposed that once we do our analysis on VTA and Muni, we compare and contrast the data to further analyze the performance of different transit agencies in the Bay Area. Adina was really keen on how our data would be visualized with GIS and what insights this would show for Caltrain access within communities of concern. Both Ian and Adina pointed out how difficult it is to change schedules (as we also discussed with Deland, there are many factors that go into redesigning transit schedules). Therefore, Adina recommended that we focus our recommendations on small tweaks that can be made rather than overhauling the entire Caltrain Connection systems. What We Observed/Learned This week’s forum on environmental justice was greatly insightful to our project especially since we are focusing on Communities of Concern in the Bay Area and how to serve them better with public transit. Such areas potentially have been underserved by transit, so we go in attempting to resolve the issue with our community partners. Hearing the speakers discuss their strategy and work gives us an idea of what to expect in such advocacy work and draw parallels with Friends of Caltrain or Seamless Bay Area. We have also looked more closely into the final deliverables of past sustainable transportation projects in this class. By exploring their websites and skimming their reports, we have gained insight on the best ways to communicate our findings. Critical Analysis/Moving Forward Over Thanksgiving Break and through the conference, we will:
Adina also had brought up that VTA has recently updated their bus schedules and is to release them after the term ends. We have initiated contact with VTA to see if we might get access to a version of the schedule to use in our analysis, as this could be an opportunity to point out any areas for improvement moving forward. Update on Project Activities As we focus more on transit access to Caltrain stations, emphasis has been placed on determining the accessibility to bus service in Communities of Concern. Quarter-mile buffers--which serve as an ideal walking distance to a transit route--have been drawn out for each SamTrans, MUNI, and VTA route and compared with overlapping Communities of Concern. Areas of CoCs (or entire CoCs) not within this quarter-mile buffer will be observed and analyzed by the team in conjunction with the schedule analysis being completed. Our goal this week was to start developing portions of the final report that were independent of the mapping analysis, such as the Literature Review. The plan was originally to have a completed rough draft of this Lit Review as well as an executive outline for the rest of the paper. However, due to an increased workload from other classes and jobs, the Lit Review is still in outline form and hasn’t been synthesized yet into a complete piece of writing. Despite this setback, we are still ahead of set timetable for this report, and aim to complete the rough draft of the Lit Review within the next couple of days. The rest of the document, in the meantime, has been growing via an executive outline and should soon be a complete map of our written report. Our goal is to finish our scheduling analysis over the weekend. We have been able to generate transfer times for one specific Samtrans Caltrain Connector as a proof-of-concept, so after we generalize our code to apply to the entire list of Samtrans Caltrain Connector arrival times we will be able to get the data we need for all of them relatively simply. Once we have this data, we will attach it to the existing geographical data we have, which will allow us to visualize which specific Caltrain Connectors have the longest delay times and how these overlap with Communities of Concern. Working with our own data will allow us to expand the scope of the Grand Jury report analysis in a geographic way that leads us to further recommendations. What We Observed and Learned This week’s lectures were particularly useful for our project as they dealt with transportation. Listening to our guides from Stanford Transportation, for instance, shed light on the challenges that are associated with running even a small form of local public transit. Keeping these challenges in mind when making relevant and feasible recommendations from our analysis is crucial - we recognize now the intricacies of making changes to established schedules and the constraints and challenges that are associated with each change. We wrote a set of functions in Python to generate transfer times for all Samtrans Caltrain Connector bus routes giving us a quantitative way to work with early arrivals and delays that were described in the Grand Jury report. It is clear that SamTrans schedules must be redesigned to make Caltrain more accessible for those needing to use other transit systems to reach them, as the original report found. Attached is a screenshot of what we found for the SamTrans that ends at the Redwood City Lane A station. 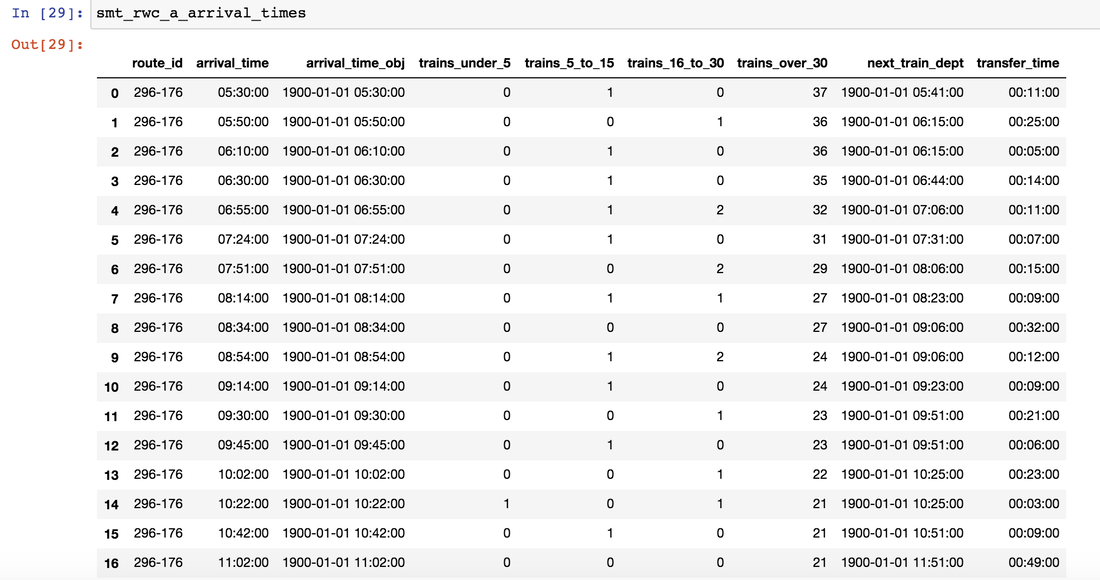 Critical Analysis/Moving Forward
After we finish generalizing our code to generate transfer time statistics on per bus-route level, we will export this data and use it to design our final maps. As mentioned earlier, producing our own data allows us to scale up the analysis in the Grand Jury recommendations and to take advantage of the geographic nature of our data and of the project. Although we had planned to have a set of draft recommendations by this point in our project, pivoting at this point means that we have pushed back this timeline until later this week. We are confident based on the significant technical progress made this week, in combination with our accumulated knowledge of the GIS software, that we are on track to have our deliverables in order. Update on Project Activities
At this time last week, our team was struggling to find new, significant recommendations for this project. Settling at one concrete recommendation would have put the rest of our GIS analysis to waste, so we geared up for an important call with our community partners. On Monday, our group convened to discuss our concerns, and came away with a newfound clarity around the project as a whole. Thinking outside the scope of suggestions limited by distance to relevant stations, we are now considering other significant factors, such as the robustness of bike route infrastructure around public transit routes, how the topography of the routes, especially in mountainous or hilly regions around CalTrain, are affecting commuters, the accessibility of highway crossings and other physical infrastructural aids to travel, and how street width classifications can help us narrow down the changes that are most effective. As these recommendations are made over the remainder of the project, we hope to remain in close contact with our community partners to help us review these recommendations in the wake of our final report and StoryMaps. Adina, in particular, can help us with the content of our recommendations and how these can be phrased in constructive ways. Ian, who is more familiar with computerized data analysis, can help us with the visualization of these recommendations and whichever elements of trouble we are having with StoryMaps. In addition, our community partners have pledged to help us obtain any data sets we need for analysis, specifically with the more elusive data on bike lane networks in the Bay Area. Other potential sources of data include the VTA, MUNI, and BART sets as a way to corroborate our recommendations and cross-reference their services with our findings to remove any duplicated areas of service we may find. Since the call, we have already obtained the data from MUNI and VTA. This updated scope of work helps us expand beyond finding just recommendations for service outside of a certain radius and incorporates a wider set of criteria for our recommendations. As reported on last week, our Literature Review for the final report is underway. Most of the material that is relevant to our project hasn’t been covered in lecture yet (Transportation is scheduled for Week 8) but our team members have nonetheless started to review that literature already. In addition, we are reviewing older readings, especially the Plan Bay Area 2040 reading, which provides useful information and context to the transportation challenges that we are analyzing. What We Observed and Learned To ground ourselves in the new project direction outlined by our community partners, we decided to revisit the Grand Jury report to re-orient ourselves by reviewing the issue of route scheduling on transit connections. In this, we were reminded that only 34% of all SamTrans “Caltrain Connection” routes result in feasible and attractive transfer times (5-15 minutes). Because our project is now focusing more on the improvements made through schedule changes, we think that this statistic found in the report is highly relevant to our work from here on out. Critical Analysis/Moving Forward Now that we have compiled most of the data sets that we need in order to start carrying through our analyses in GIS, our main focuses for the coming week will be to flesh out the story maps website, continue working on making recommendations, and begin writing up sections of the final report. As of now, we have some maps added to the story maps website, but we need to work on the descriptions and general design of the site. For recommendations, we are now going to start focusing on missed connections between Caltrain and the Bay Area bus systems to better serve the needs of our community partners. After rereading the Grand Jury report, we noticed the Caltrain connector data was not specific enough (giving only a handful of examples) by bus route in order for us to analyze the changes that could be made in scheduling, so we will be re-creating that data with analysis tools in Python and R. We will look at the average wait times for waiting for Caltrain after using the bus and vice versa during peak commute times. From there, we will determine use the SamTrans information already in our GIS to show how schedules and routes might be changed to allow better access for Communities of Concern. This change from our original plan was also informed by the realization that our original intentions moved beyond the scope of the project and also neglected to factor in the Grand Jury report, which is a major contender for our project. By narrowing down our focus, we will be better equipped to produce results in the coming weeks. As our analyses move forward, we are continuing to work on the final report, particularly in the project purpose and literature review sections. We will go over all of the relevant readings and project descriptions in order to find content for these sections. Update on Project Activities
This week was spent largely on refocusing our scope and more clearly defining our approach going forward. With one month ahead of us, we aim to dedicate significantly more time actively mapping and putting the rest of the project deliverables together. In this regard, we have decided to split up the roles among ourselves for the coming week(s):
In terms of our progress on mapping activities this week:
What We Observed and Learned A recent study from MIT looked at the effect of lowering transit fares on lower-income individuals in the Boston Area. Their methodology involved giving 50% discounts off of rail fares for those who participated in the SNAP program and tracking their transit usage and destinations through daily text messages and CharlieCard (their version of a Clipper card) usage data. In their preliminary results, they found that discounted fares increased ridership by about 30%, and they also found that low income riders are more likely to travel at off-peak times and to use prepaid transit cards to travel. They also were found to utilize buses heavily and switch between modes often. The results of this study can help us to think about possible recommendations we can make after finding Communities of Concern which lack access. Another question we have asked ourselves over the course of the past week is, “What is ‘access’?” In thinking about the real life experiences of individuals “accessing” transit, it is unreasonable to believe that they can travel “as the crow flies” within a 3-mile radius of the Caltrain stations. Instead of this technique, we have used our network analysis tools to create an isochrone analysis of the reasonable distance a person can travel on existing infrastructure (bike lanes, roads, sidewalks, etc.). This better represents the routes that people can take to get from their Communities of Concern to transit stations, and it will give us a better understanding of which transit routes actually intersect with pedestrian routes. Critical Analysis/Moving Forward As we progress on our mapping analysis, we are looking at starting our final project deliverables. In order to ensure that our recommendations are accurate and impactful, we are working on developing a draft of our final project recommendations to relay to our community partners with the goal of receiving critical feedback to further develop our analysis. These efforts are in tandem with our continued work in GIS to find improvements for areas with Communities of Concern. With this wide breadth of area to cover and a decreasing, finite amount of time with this project, further coordination with our project partners is required in order to cater to their needs - this coordination will be especially useful in case the deadline becomes a pressing concern, helping us narrow down our scope of work. One area that our team is hoping to incorporate as a part of our final deliverables is the integration of general commute patterns on the Peninsula. This examination of the usage of existing transit options in the Bay Area may help us gain some perspective into which areas of the Peninsula experience a gap in available transit solutions and provide recommendations through that analysis. This, and other analysis efforts, need ridership data from SamTrans since it is one major transit provider in the Bay Area. Although this data is not open source, we have contacted some connections at SamTrans and hope to have data for GIS analysis soon. In the wake of the final written report, we have started allocating our roles to complete the writing. After a team meeting this past week, we recognized that our team members specialize in different skills - those who are less proficient in GIS analysis are looking forward at portions of the final report that require more research and writing work, such as the Literature Review and synthesizing the Project Purpose and Methodologies. Reallocating this work helps prepare our group for the increasing amount of work in the final weeks as our project winds to a close. Update on Project Activities
Last week, we completed our Scope of Work and set our timeline and goals for the rest of the quarter. As Week 5 comes to a close, we are continuing to evaluate our progress and assessing the feasibility of the work we set out for ourselves. We have observed ourselves, for example, spending more time creating a workflow to analyze transit data for all transit systems rather than working specifically with SamTrans, VTA, or MUNI data. We are realizing that a presentable final product is only partially the methodology, and that to remain on schedule for producing results, we will have to spend more time in the next few weeks than planned. However, we have developed a solid intuition of how to actually apply techniques like “isochrone analysis” (service area) to our transit and bike datasets using the tools we have access to. We will focus in the coming weeks on leveraging these new skills to multiply the number of our conclusions we have made thus far. After receiving comments from Deland, Adina, and Ian on the Scope of Work, we have spent some time discussing how to implement the feedback. Specifically, we need to think more deliberately about our Project Definition and Seeing the Big Picture sections. Deland raised many important questions that are challenging us to think critically about the choices we are making in our project, which will guide us in our further analysis and what data we choose to include in our mapping analysis. On Monday we spoke with Adina and Ian about our progress and next steps. They were pleased with our Scope of Work and timeline for the rest of the quarter. We updated them about our GIS mapping analysis and provided our first recommendation: there is one community of concern, located in San Bruno, that is completely unserved (in any part) by SamTrans Caltrain connection bus routes, posing an accessibility concern. Our next step is to put this recommendation on Story Maps (to avoid leaving Story Maps until week 8, as Deland brought up in her comments for our Scope of Work). Together, we established that by our next meeting on Thursday October 31 we will have completed analysis to present 2-3 recommendations for policy to improve Caltrain access. We believe this is a manageable goal to complete over the next week, especially with the learning curve to use Story Maps and how to present our recommendations. We have also continued collecting GIS layers for bike lanes (all three classes) and streets in San Mateo county. After meeting this week to work on GIS together, we were also able to complete a network analysis of the collected bike data to see what areas are bikeable via a max 3-mile trip from a Caltrain station, looking next to integrate our elevation data. We still have a lot to learn about network analysis and other commute data that Deland directed us to. In the meantime, however, we have made use of ESRI’s plentiful tutorials on their software, and have reached out to staff at the Spatial Analysis Center for further resources. The Transportation Commission activity in class was actually seen as an insightful exercise on where our recommendations might end up: being presented to the City of San Mateo to improve equitable Caltrain access. It is thus important that we are able to present them in a coherent and visual way, backed by our data analysis of who will be benefiting and highlighting very specific changes we are advocating for. What We Observed and Learned As we progress in our analysis, our community partners continually provide us with more useful resources which help us with our conceptualization of this project. One project currently ongoing in the Bay Area is extremely pertinent to our project: Caltrain is conducting an equity analysis as part of its Business Plan as part of its mission to make its services more accessible and attractive to the general community. Additionally, SamTrans is conducting a Comprehensive Operations Analysis to review and improve its routes. As part of a mandate from the Grand Jury report, this initiative is attempting to improve its connections with Caltrain. These two transit organization-led initiatives are directly relevant with our mapping analysis. Our group cannot help but notice the similarities between our work with the Friends of Caltrain and what these transit agencies are currently aligning themselves with doing. Hopefully, these aligned missions mean that our recommendations are received with a real hope for productive modifications to public transit routes. Critical Analysis/Moving Forward As we look ahead to week 6, our primary goal is to continue implementing layers as defined by our Scope of Work. The layers and their details are as follows:
As we discussed with Adina and Ian, we need to spend this week curating a batch of recommendations that they will review and give us feedback on by Thursday. We agree that it is best to first receive feedback before moving forward with more analysis to make sure that we are on the same page with our analysis methodology and the quality of the recommendations. Strong and clear data visualization will be essential toward making our case. Ian is an expert at visualization, so we are eager to hear his thoughts on how we can best achieve our goals of communicating our recommendations successfully. We also hope to start working on our final report over the next week. While we currently have not finalized any recommendations with our community partners in order to include them, we can still begin assembling our introduction, literature review, and summary of ongoing initiatives to educate and influence the community about public transportation. |
Archives
November 2020
Categories
All
|
 RSS Feed
