|
This week our team has been focusing on the best way to approach writing our final group report for our community partner. We have found reputable articles and outlined our paper. We want the paper to be both cohesive and consistent in our analysis of the two case studies. We did not realize how challenging writing a group report is, so this week in our team meeting we brainstormed various ways to write the paper. The first idea we came up with was assigning each person an aspect of the case study to focus on; for example, one person could focus on the economic aspects, such as incentivizing businesses to move into innovation districts, for both the Boston Seaport District and the Freemont Innovation District. A drawback to this approach is that the two cases are different and we don’t want to force a broad framework that may not necessarily fit or apply to the situation. The second idea we came up with was having two people focus on the Boston Seaport District and having the two other members of the team focus on the Fremont Innovation District. We are going to continue to discuss the best approach to writing the paper, as we add to our research and further develop our outline, but we all agreed that it would be best to meet to draft a conclusion and best practices section so that we can compare findings, discuss why the case studies matter, and relate our findings back to Milpitas. We think it is very important to synthesize our findings as a group, and make sure all of our perspectives are represented in the executive summary.
Next Friday, we are going to the Fremont Innovation District to meet with Christina Briggs, the Economic Development Director of the City of Fremont. We are planning on touring their district. Below are some of the questions we are planning on asking Christina:
On Monday in class, we visited the Stanford Educational Farm and heard from Ryan Thayer on what he learned from working with corner stores in the Tenderloin District. The unifying thread for our visit to the farm and our discussion with Ryan was food security. While, the development of an innovation district in Milpitas does not directly tie back to food security, the introduction of an innovation district to the Milpitas area does have the potential to impact the composition of the city, and thus potentially impacting the food landscape. On our visit to Milpitas, we noted that there was only one grocery store in the city, a bargain grocery store located on the outskirts. Alex pointed out the location of the Sunday Farmer’s Market and told us that many people buy their fresh produce from there. Additionally, many of the restaurants we saw were mom and pop shops and many of them also appeared to be run by immigrant families. While the main focus for our project, is not on food security, I think we can find ways to include this in our report as it is an important topic relating back to social equity, something our team is really interested in. Additionally, this is an important issue for the city to consider going forward, as it is important to make sure residents have access to healthy options; however, the city must be strategic to work with existing restaurant and grocery store owners, so that they do not cause local businesses to be displaced. Update on project activities
Today, we had a very informative meeting with Alexi. She walked us through the processes going forward for converting our transcripts into edited audio clips. We’ve also done a few things to move forward with the editing process and get us toward our deliverables. We have each created a folder in our shared drive to hold our transcriptions. This is where we will copy the text version of our transcriptions. During our transcription processes, we each highlighted sections that we thought we could potentially use in our final clip. We will also be adding these highlighted sections to our drive, and using that to work through creating a shorter clip. We are wrapping up our transcriptions and are looking forward to embarking on the editing process. Our next steps will be making the first stages of a script. Alexi explained that we can either approach this process as “parsing down” large blocks of text from the interviews, or we can cut-and-paste sections of the interviews to create some sense of a five-minute story. Once we have created a “paper cut” that is a rough cut-and-paste version of the text from our interview, we will send it to Alexi to get advice before we move forward. We will be in close communication over email, especially as we start the editing process. We will be using “free trials” for Adobe Premier to edit our audio clips, although we won’t start editing the actual audio until we get a final script for the text-versions of the transcriptions. What we observed and learned This week, we have learned a ton from our individual interview transcriptions. As we approach the end of the “transcription” part of the project, we are all reflecting on the content and power of the stories that we’ve heard. The stories are vastly different, and each draw upon different elements of the class. When beginning to think about how to create our edited clips, it is increasingly important to use the readings and frameworks that we have learned to make our “paper cuts” and then scripts. Alexi recommended that we draw upon “Problems of Editing First-Person Sociology,” and other readings that she will send out soon to help us with the process. We each got to talk with Alexi about how the interviews are sitting with us, and what sorts of themes they brought up. Thinking about themes and favorite portions of the interviews will help us find a jumping-off-point for the editing process. Critical analysis/moving forward Now that we’ve finished the transcriptions, our next step is selecting passage for our video. Compared to editing transcripts, we have a lot more liberty, since we choose which sections to include in our narratives and which to exclude. As such, we need to approach this next phase of the project with a lot more intentionality. We have several ways to approach the process of selecting passages. Are we going to include snippets of every subject the interviewees touch on, or should we try and select one or two topics and build a narrative around those? It’s likely we’re going to choose the latter because that provides for better storytelling, but then the question of which topics we will pick arises. Given the mission of our organization, we are going to pay special attention to housing moving forward, but any other themes should vary from interview to interview. For example, interviews with the African Advocacy Network, a Bay Area nonprofit that provides services and advocates for African immigrants, would include discussions about the experience of immigrants and the diversity in the African community. Once a topic is chosen, the ordering of audio is also a part of the process that deserves special attention. Many of the questions in the interview focus on trends. Is it preferable to focus on personal experiences of the interviewee, or broader trends that they’ve noticed about housing the Bay Area. All of these are questions that we need to consider as we move forward. Update on Project Activities
This week was spent largely on refocusing our scope and more clearly defining our approach going forward. With one month ahead of us, we aim to dedicate significantly more time actively mapping and putting the rest of the project deliverables together. In this regard, we have decided to split up the roles among ourselves for the coming week(s):
In terms of our progress on mapping activities this week:
What We Observed and Learned A recent study from MIT looked at the effect of lowering transit fares on lower-income individuals in the Boston Area. Their methodology involved giving 50% discounts off of rail fares for those who participated in the SNAP program and tracking their transit usage and destinations through daily text messages and CharlieCard (their version of a Clipper card) usage data. In their preliminary results, they found that discounted fares increased ridership by about 30%, and they also found that low income riders are more likely to travel at off-peak times and to use prepaid transit cards to travel. They also were found to utilize buses heavily and switch between modes often. The results of this study can help us to think about possible recommendations we can make after finding Communities of Concern which lack access. Another question we have asked ourselves over the course of the past week is, “What is ‘access’?” In thinking about the real life experiences of individuals “accessing” transit, it is unreasonable to believe that they can travel “as the crow flies” within a 3-mile radius of the Caltrain stations. Instead of this technique, we have used our network analysis tools to create an isochrone analysis of the reasonable distance a person can travel on existing infrastructure (bike lanes, roads, sidewalks, etc.). This better represents the routes that people can take to get from their Communities of Concern to transit stations, and it will give us a better understanding of which transit routes actually intersect with pedestrian routes. Critical Analysis/Moving Forward As we progress on our mapping analysis, we are looking at starting our final project deliverables. In order to ensure that our recommendations are accurate and impactful, we are working on developing a draft of our final project recommendations to relay to our community partners with the goal of receiving critical feedback to further develop our analysis. These efforts are in tandem with our continued work in GIS to find improvements for areas with Communities of Concern. With this wide breadth of area to cover and a decreasing, finite amount of time with this project, further coordination with our project partners is required in order to cater to their needs - this coordination will be especially useful in case the deadline becomes a pressing concern, helping us narrow down our scope of work. One area that our team is hoping to incorporate as a part of our final deliverables is the integration of general commute patterns on the Peninsula. This examination of the usage of existing transit options in the Bay Area may help us gain some perspective into which areas of the Peninsula experience a gap in available transit solutions and provide recommendations through that analysis. This, and other analysis efforts, need ridership data from SamTrans since it is one major transit provider in the Bay Area. Although this data is not open source, we have contacted some connections at SamTrans and hope to have data for GIS analysis soon. In the wake of the final written report, we have started allocating our roles to complete the writing. After a team meeting this past week, we recognized that our team members specialize in different skills - those who are less proficient in GIS analysis are looking forward at portions of the final report that require more research and writing work, such as the Literature Review and synthesizing the Project Purpose and Methodologies. Reallocating this work helps prepare our group for the increasing amount of work in the final weeks as our project winds to a close. Update on Project Activities This week, our group has mainly been working on finalizing and publishing the various formats of our survey. Romeo was able to translate the online survey on Stanford Qualtrics into Spanish to be used for online distribution via our various channels. Kelli also worked this week to create a one-page, double-sided paper version of our survey for later in-person distribution. She sent this to Alex and Christina and received their approval. Additionally, we set finalized our Spanish Speaking Ambassador focus group for November 7th at 6:30pm. Our largest project deliverable thus far, however, is likely the online publication of the survey. Since its online release on October 29th, we have had 143 responses, all of which were from individuals in households with internet access. The graphs below summarize the community’s responses to some of the most notable accessibility and demographic questions. 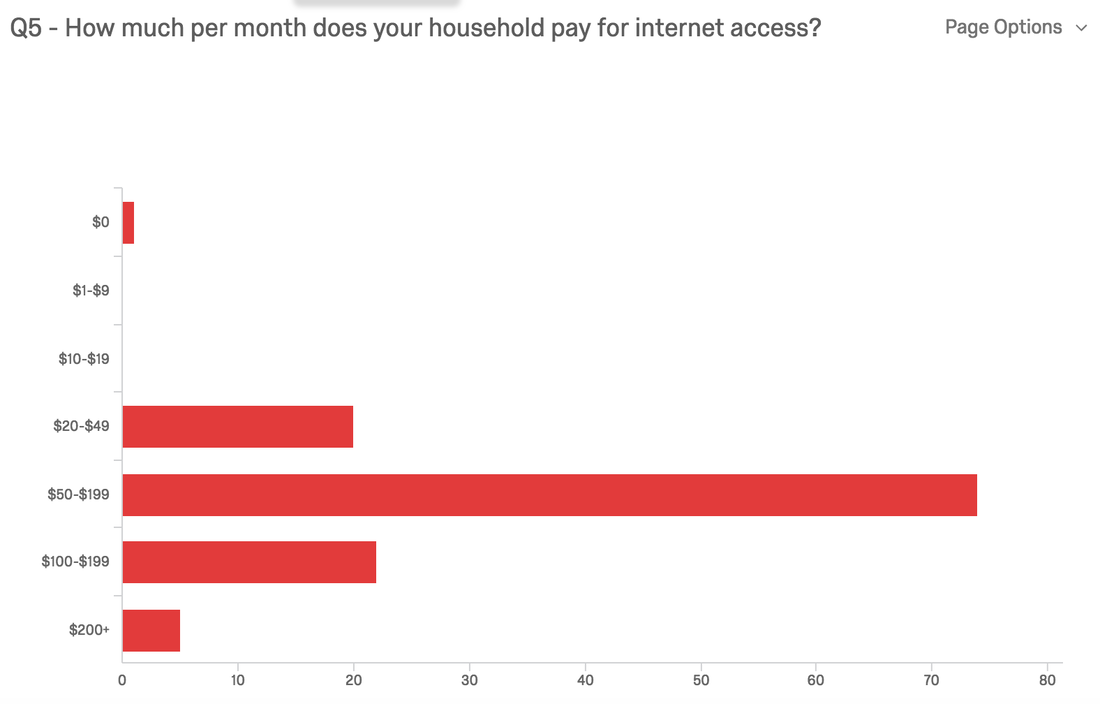 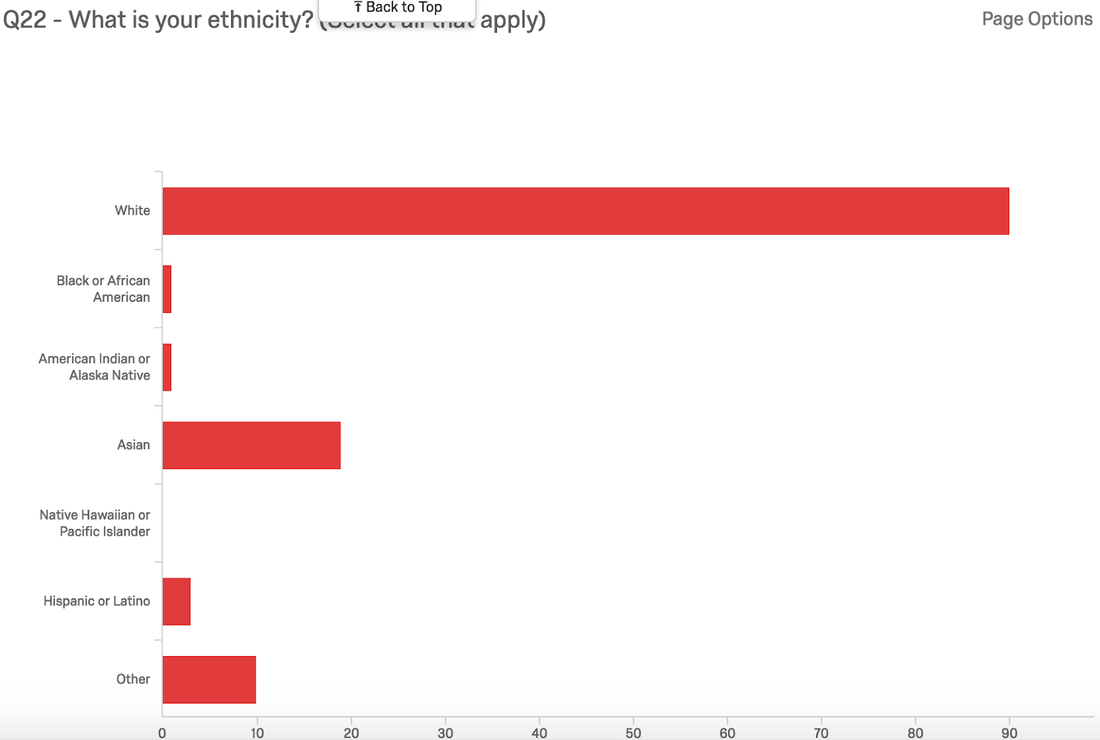 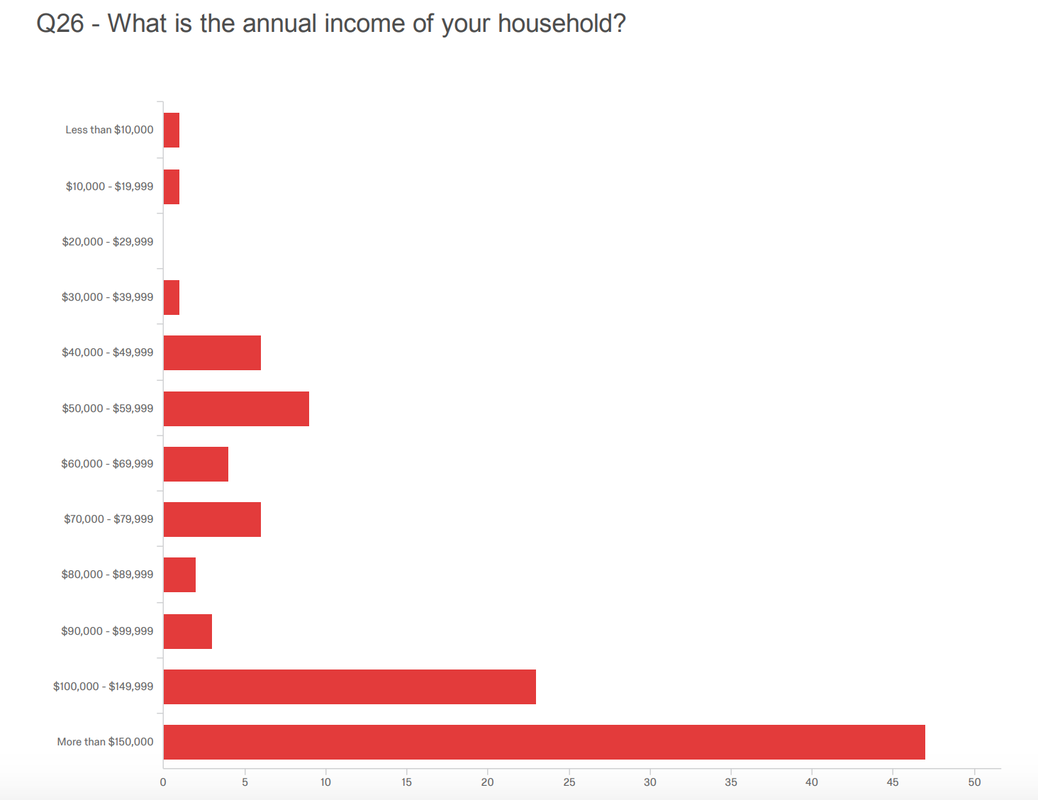 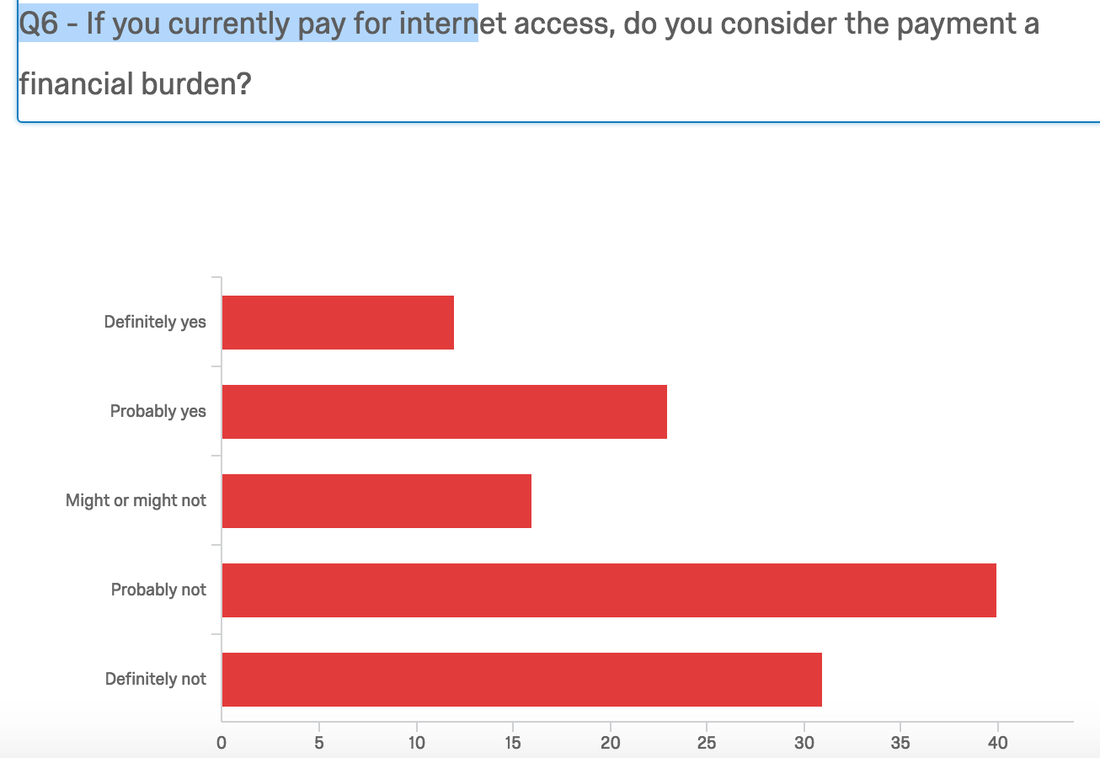 What We Observed and Learned
The article on the Red Hook Wifi Project was particularly interesting and especially relevant this week, considering we are starting to get our survey results back. One of the most interesting components of the Red Hook plan was their focus on providing non-mobile WiFi access, based upon their conclusion that most households accessed the internet via their mobile phones, not via computers/ wireless routers. Thus far, it is unclear how much this pertains to the digital divide in Mountain View, as a lack of internet access could also be attributable to a lack of access to hardware - phones, laptops, desktops, etc.- or a lack of digital literacy. According to our current survey results, 121 respondents use a traditional WiFi router, 44 use a Mobile Provider’s LTE, 19 use public WiFi, and 10 use some other form of internet access. There is also an interesting juxtaposition in regards to location. Red Hook, Brooklyn- a waterfront community fairly isolated by highways and waterways- was hit particularly hard by Hurricane Sandy and has been working to recover ever since. Mountain View, home to Google, LinkedIn, and Inuit is located in the heart of the booming tech scene and struggles to keep up with the pace of the growing industry. This brings forth the idea that the “digital divide” likely manifests itself in very different ways and subsequently must be addressed in different ways depending on the structure of the community. Ultimately, said issue, while national, is perhaps best addressed on a local scale. Critical Analysis/Moving Forward In terms of where to go from here, our major issue is probably the lack of diversity in survey respondents and, specifically, the lack of response from particular target groups of interest- the elderly, low income individuals, minorities, mono-lingual non-English speakers, and, most obviously, those without internet access. Each of these groups will require a different approach in regards to outreach. Surveying the elderly would best be done in-person at senior centers. The input of mono-lingual Spanish speakers will be included in next week’s focus group. Targeting the other groups will likely require the identification of on-site canvassing locations and in-person surveys. This is ultimately the goal for the next couple of weeks: utilizing the data from our online survey to identify areas of low-response and canvassing these areas to collect survey data. Our project with the Tech Museum is very closely related to the idea of urban resilience that we discussed in class on Monday. Our project involves collecting stories of climate change adaptation and mitigation - which is a form of urban resilience. Through our interviews, we are learning about different forms of urban resilience in the Bay Area. Although, like we talked about in our discussion on Monday, there are several different categories of urban resilience, our project focuses on environmental resilience in particular. We have been, and will continue to reach out to communities, individuals, and organizations to hear about how climate change is affecting them, but also what they are doing to adapt to climate change, and create resilience within their lives, work, or community. I will now describe an example of a resilience story we have encountered in the community through our project.
One individual we spoke to works in agriculture, and spoke about the negative effects of climate change on the weather and seasons, and how he can’t even remember what “normal” seasons are like. Because of climate change and drought, farmers are grafting their plants and trees more often than in the past. Grafting is the process of training two different plants to grow as one. For example, a farmer might use a plant with a more drought-resistant root structure, and graft it to the top of a plant that produces good fruit. This is a process that farmers are using to make their crops more resilient to climate conditions. By growing resilient agriculture, food supply in the city is generally more resilient, making the urban sphere more resilient in general. This example represents only one kind of resilience effort - agricultural - in the Bay Area, although there is so much being done. Through our project we are aiming to collect stories of resilience from farmers, urban planners, individual community members, and many others - we can’t wait to collect as many voices as possible and share them with communities through our small part of the exhibition in the Tech Museum. Resilience as was stated during class, is the ability for a system to handle a shock or disruption and endure livelihood for the people in the city. The reading provided the three examples of approaches for resilience management: engineering, social, and organizational. One of the biggest takeaways from the reading and lecture was that social capital matters a lot in resilience. Social capital is the social network that one has. This can be an issue under resilience because if people are not connected then they may not be able to reach resources that would help them or contact the right people needed. By being resilient and creating social capital, people are connected to others in their community which can allow for mutual growth and a mutual force to combat climate change such as in voting, organizing, farming, and creating connections to companies that also have large impacts. Social capital allows for connections across disciplines and geographic boundaries which is helpful in a large space such as the bay area. Resilience is needed here because it gives low-income communities an opportunity to reach out to people in power positions or to even organize with themselves and create movements for change and to advocate for their communities that are impacted largely by climate change. Another issue that can fall under resilience is gentrification of neighborhoods that have cultural and ethnic/racial roots. Resilience is needed here in order to stop housing prices from rising and forcing people to move, causing cultural shifts and making the affordable housing crisis worse. Environmental racism is also a problem that falls under resilience. Placing toxic chemical waste dumps, trash dumps, or even harmful medical supply dumps near low-income, or predominantly Black/Latinx neighborhoods has had serious health issues. With climate change and these dumps releasing more toxins and pollution, the health risks will be greater for these neighborhoods who can’t afford proper health treatment. Resilience is needed here for their own safety and well-being. In terms of agriculture, resilience is needed in food deserts and in areas of drought. These issues are impacting food access and an economic industry. People’s livelihood depends on the production of these agricultural products and people need these products for their food consumption. Resilience would allow for proper distribution of water sources for these areas while being conservative of water resources. Resilience would allow for solutions to food access. Overall, in all of these issues and many others, resilience is needed for survival. Resilience combats the impacts of climate change and the injustices that are byproducts of this crisis. Particularly, low-income neighborhoods of color are more susceptible to the impacts of climate change and there needs to be community resilience in order to create strategies of mitigation and adaptation and receive proper aid from other communities or organizations. Considering our project focuses on the impacts and adaptation/mitigation to climate change, the ABAG and MTC should prioritize low-income communities of color as they are the most vulnerable to climate change. Not only are these communities subjected to environmental racism, but they lack the socioeconomic mobility to be able to respond to ever more threatening natural disasters. In specific to California, natural disasters such wildfires,droughts, and sea level rise are all threats to low-income communities of color who may not have the resources to prepare/migrate in response. However, we recognize that our project doesn't solely focus on just low-income communities of color as we are supposed to collect stories of all people in the bay area who have been impacted/mitigated to climate change. We are still currently looking for a balance between stories that elevate voices which need the most exposure versus those who may be most accessible to us. As we consider topics talked about in class like the four pillars of sustainability, it is important for the MTC/ABAG to preserve the cultural and social aspects of these low-income communities of color as they may be vulnerable to harmful pressures such as gentrification. As of now, both the ABAG and the MTC have created a project called Horizon that won't only look at transportation and housing but at economic development, resilience, and the effects of technological development. These are important topics in that they may explicitly help low-income communities of color since they require the most help in addressing economic and technological inequality. Planning should be careful in that these communities are already facing increasing property values and pressures of the silicon valley to relocate. We suggest that the MTC/ABAG be especially careful in the Horizon project in focusing the needs of its most vulnerable populations. |
Archives
November 2020
Categories
All
|
 RSS Feed
