|
Sustainable Cities is a service-learning course offered through the Program on Urban Studies and Earth Systems Program. Students learn and work collaboratively with Bay Area government agencies and community organizations to support their sustainability goals. Now in its sixth year, the class attracts undergraduate and graduate students from a multitude of disciplines, ranging from urban studies to civil and environmental engineering to law and public policy majors, to support clients on meaningful fieldwork-based projects.
The Winter 2015 class worked with five community partners on the following projects: 1) assessing feasibility of an equitable and integrated Bay Area public transportation fare structure - Friends of Caltrain; 2) mapping residential displacement and demographic shifts in San Mateo County - Community Legal Services in East Palo Alto; 3) developing a public engagement strategy for household hazardous waste disposal in the City of San Jose - Department of Environmental Services; 4) creating a toolkit for Women Bike SF to increase bike ridership in San Francisco - San Francisco Bicycle Coalition; 5) providing technical and policy analysis for the City of Oakland soft story retrofit program - Resilient Oakland Initiative. The final presentations took place on March 11, 2015 at Stanford University (Video).  Update on Project Activities
This week, we finished up our calls for good and began working on our deliverables! We dove into consolidating and analyzing our data, and have imagined fully the ways in which we will be able to create a deliverable to represent the story that we have uncovered through our calls. After our meeting with Jason and Ashley last week, it felt good for our team to be on the same page and ready to create something meaningful and impactful. In class, we discussed data visualization and the importance of color and typography basics, along with an overview of AIM (Audience, Intent, Message) with an emphasis on maps. On Monday during our work session, as a group we discussed how we would split the work so that it would best suit our strengths. What we decided is that Toni would primarily work with analyzing the data and using Excel to reorganize and produce trends. Jana will be working on the written report, with an emphasis on the Literature Review. Lastly, Jazlyn will be focusing on the website and infographic. We want to maintain an open line of communication through this whole process, but decided that it was more productive to split up the tasks rather than trying to have everyone pitch in a little on everything. This also provides a good framework to divide up our presentation time on Monday. What We Observed/Learned As we all finished up our calls, it became very clear truly how deeply these evictions were impacting our populations in a way that we didn’t expect. So many of our clients were telling us that they had spent months homeless, couch surfing, or living with multiple relatives. Story after story emerged of people who, even despite the few months of preparation that CLSEPA’s settlements usually resulted in, still were unable to find stable housing after their evictions. On a more personal note, this week, we all took a moment to appreciate how smoothly this whole process has gone for us as a group. We are all in multiple group projects this quarter, and we were so appreciative of the fact that we have all managed to be there for each other in a flexible way, stepping up and stepping back as needed to create a really strong team overall. We have been pretty much on the same page all the way through the project, which has made working together seamless and easy. Critical Analysis During class on Wednesday, we began to think about the AIM of our own project. Our project is complex because there are many stakeholders with incredibly oppositional viewpoints. Are we pitching to those who are suffering, to empower them to make change within their own communities? Are we trying to show lawmakers that this is something that cannot continue? Or are we trying to convince landlords that their eviction practices are unjust and inhumane? Our project obviously is going to be at the intersection of all three, but ultimately, the ones that can effect dramatic change on the legislative landscape and rights of evictees in these cases are lawmakers. Even though our deliverable has changed, our mandate is still the same: there should be renter protection ordinances everywhere in the Bay Area. Renter protection is not an option. As we craft our deliverables, we want to make sure that this message comes across overwhelmingly clear, so that CLSEPA can make a case to those who make the policy into reality. Final Steps
This week we focused on getting together our deliverables and putting the finishing touches on everything we committed to deliver. This ended up being a lot of data analysis and thinking about good ways to represent data. We also continued the development of our branding and began compiling our ArcGIS Map. ArcGIS Map: Katie met with David in the GIS lab on Friday to finalize data sources for the map. We will be using shapefiles from the SF Find maps to denote neighborhoods in our map. All the data from the surveys regarding geographical information is extracted and we are in the process of transferring that data to our GIS map. The layer of the map Katie is currently working on includes over 400 start and end points of the members' commutes to track which neighborhoods are most popular for bikers. The next layer which will be completed by Monday will include special routes. Survey Response Category (Qualitative) Analysis and Branding: One of the big goals this week was to analyze the write-in responses that we received from the survey we sent out to SFBC’s female members. The replies were in response to the question “Do you have any other comments on biking in SF or ideas to encourage women ridership in SF?” We received a variety of responses that varied significantly in subject matter. To better analyze the responses in order to extract valuable information from them, we did an initial read-through of the responses and came up with 8 categories of comments/ideas that arose frequently. After discussing the categories with Janice, we narrowed them down to the following six: 1) SAFETY: Infrastructure such as separated bike lanes and other measures to protect cyclists from automobiles. 2) BEHAVIOR: Tools to increase confidence and skills on the road, including workshops and classes. 3) COMMUNITY BUILDING: Facilitating friendships and support networks between female cyclists by making sure the existing bike community is more inclusive as well as also finding women-only spaces. 4) BUILDING BIKING INTO DAILY ROUTINE: This includes things like aesthetic/hygiene concerns and bike storage options/theft avoidance. 5) BIKE CLOTHING/GEAR 6) BIKE AND GEAR PURCHASING: In addition to help with buying bicycles, this includes things like helping women find friendly and helpful bike maintenance options. We are now in the process of taking a tally of the number of times each of the following categories come up, and will soon be better able to rank each of them by the number of times the survey responders brought them up. We also continued to develop our logo this week, receiving feedback from some additional members of the SFBC. We will contact a graphic designer this week and finalize the logo. We also drafted our mission statement this week, incorporating information from our discussion with Janice and from the focus groups, and we will continue to refine it and the other branding materials over the next few days. Quantitative Data Analysis: This week we finished processing the data from our surveys. The process of converting the information from our survey responses (about 400 replies!) into usable data was challenging. The biggest challenge was figuring out an appropriate way to represent qualitative responses such as: “not sure” or “somewhat encourages” into numbers that we could use to make graphs. We chose to focus this part of our data analysis on the set of questions that asked responders to rate potential ways to improve women ridership (social gatherings, guest speakers, skill-sharing workshops, regular bike rides, online discussion forum, and bike education). For these responses we paired each of the 4 possible responses with a number that illustrated something about how positively or negatively a responder endorsed an answer. For example we paired “doesn't encourage” with a numeric value of -1. We then used these numeric responses in order to graphically represent how our survey participants felt about specific ideas. Looking towards next week Final Presentation: The final presentation is less than a week away and we are very excited to show our community partners and peers what we have accomplished this quarter. Report: Our report which is a portion of our final deliverable will include all our survey data analysis, GIS map and findings, and final branding. Our aim is that the SFBC will use our recommendations and findings to further support their campaign and find our work useful in producing more components of a toolkit and resource guide. Website: The website is coming along and will hopefully be done not long after our final presentation. 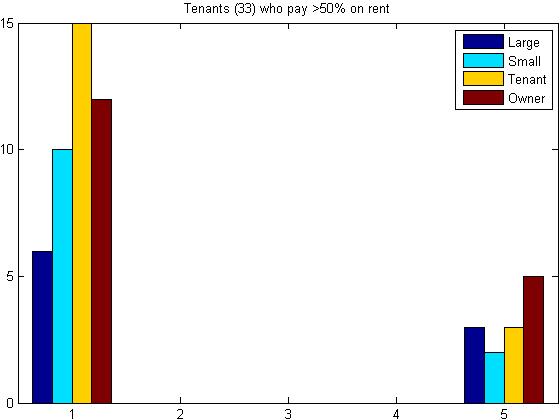 Update on Project Activities
Having spent the entire week polishing our map, we now have two maps, a combination of which will likely become our final mapping deliverable. The first map we made is a continuation of the map we began last week, overlaying soft story locations with parcel information. In addition to this information we also brought in the vulnerability data from ABAG, creating a grayscale gradient spread over the entire map. Finally, we were able to to find a street map of the City of Oakland that was put underneath the soft-story and vulnerability graphics, enabling us to hide the parcel data. This made the map look much more clean and intuitive, as parcel data includes less intuitive visual information for understanding location (street names, color-coding by land use) and many more simple black lines outlining properties, which overloads the eyes with excess information without giving any real reference. Our second map was created using arcScene, which enabled us to create a map in 3D. We decided to tie the height of the properties to number of units, after discovering that a few information sets detailing the number of stories seemed inaccurate for some locations when compared to street-view pictures of the apartment. Additionally, we overlayed that information with parcel and vulnerability data. Unfortunately, arcScene was not compatible with our street map, making this map slightly harder to read than our 2D one even while containing more relevant information. To solve this problem we plan to include a small 2D map of the region our 3D map is representing as reference. Currently we plan on creating about 4 different 3D/2D maps showcases various regions in Oakland so that policy makers and planners working with the City can see the density of soft story sites in addition to the vulnerability associated with each area. Observations/Insights Last week, we made initial attempts to extract information from available results of the survey being carried City of Oakland. Those results were not much different from the City’s broad summary of statistics, so we tried to come up with more specific questions that included several of the aspects captured by the survey. For instance, we wanted to know what factors were relevant to tenants and owners (separately) for prioritization of buildings in the soft-story retrofit program, in addition to disaggregating responses by the percentage of income spent on rent. From the many results obtained from combining these multiple criteria, we found a few interesting cases, such as the one in the figure below, showing what level of priority (1 being the highest priority, and 5, the lowest) is given to large buildings (dark blue), small buildings (light blue), buildings with low-income tenants (yellow), and buildings with low-income owners (red). The key observation is how a considerable amount of tenants who pay more than 50% of income on rent thought that it was reasonable to prioritize buildings with low-income owners, raising questions such as: are they aware of the current cost-sharing structure for improvements (70% tenant and 30% owner)? This and other questions are being analyzed to be included in our final report in order to bring new elements to the policy-related discussions being held by the City of Oakland, as well as providing feedback for further outreach activities to be implemented. Next Steps With SquareSpace, we are hoping to create an approachable forum for discussion and resources. Although many documents we have created are designed for use by planners, we plan to have dedicated tenant and homeowner tabs detailing the essentials of retrofitting with social media integration. With our presentation, we hope to bring together some of our most major contributions and understand how our individual contributions might be linked. So far, we believe that our work has covered a wide variety of the Oakland Retrofit work, from community outreach to technical models of seismic damage. In the final week, we hope to simplify and condense our current GIS maps for ease of use. The initial 2-dimensional GIS map will be a overlayed heat map, the fully zoomed out view of Oakland. 3 additional maps will focus on specific regions of this master map, zoomed in for a more detailed view of the soft-story homes in the area. Thus far, these 3 regions have been designated as: 1) the area around Lake Merritt, which has a high concentration of soft story homes, 2) The eastern portion of the city, which has few soft stories but covers a large portion of the map, 3) Regions of exceptionally high risk, located further away from Lake Meritt. With our 3D GIS map, we have opted to focus on the number of units. Thus the soft story structures that contain the most units are projected are extruded to quite a height. That way, city planners can, hopefully, with one glance, see not only which areas are most at-risk and concentrated, but also which specific locations should be emphasized when choosing where to allocate public funds. 1) Last Community Event: This past Sunday, we went to our last community events to survey: The Earthquakes vs. Galaxy Game and the San Jose Flea Market. We had a great turnout at the stadium. Almost everyone we approached completed the survey. In addition, we were sharing a booth with the City of San Jose Recycling. They used a multiple of outreach activities that we found very efficient. The most attractive was a sorting activity where the participant throws bean bags labeled as a type of waste into bags categorized into trash, recycling, hazardous waste, etc.
We had a much harder time at the Flea Market. Just as we pulled into the parking lot, we saw ominous clouds hovering over the area. After sorting out where we set up a booth for free, we realize that we were suppose to bring all supplies. The spot we were given was literally an empty lot. So we stood there, two oddballs in the middle of the flea market with clipboards and surveys. People gave us suspicious looks and the impending rain did not help. We were pushed out of our comfort zone. After half an hour, we realize that 5 surveys may be all we were getting and called it a day. All in all, while the visit to the flea market was short, we both felt that we learned a lot and most important, it did not challenge us any less, if anything, it was a bigger challenge than surveying at the Earthquakes game. As we think about finalizing our outreach strategy recommendation, we need to find a way to convince the population who do not find hazardous waste yet relevant in their lives to care. We need to make disposing hazardous waste easy and convenient for everyone. 2) ARCGIS Map: We cleaned up our data and created layers to separate the type of wastes. We are ready to make the ArcGIS online map. 3) Partnership: After seeing the activities at the booth last Sunday, we have an idea of how to create a lesson plan for our partnership with the Tech Museum/schools. |
Archives
November 2020
Categories
All
|
 RSS Feed
