|
Update on Project Activities
This week we had our first focus group with the Mountain View Spanish Speaking Ambassadors. We gave a brief overview of our project, asked them to fill out the Spanish-translated paper survey and then solicited general comments. If willing, we also asked them to distribute additional paper versions of the survey to members of their own community, as then we can further represent this often underrepresented group. The survey will also be published again through The City of Mountain View’s social media channels, as we saw a large spike in the number of responses directly after publishing. What We Observed and Learned The insights that the Ambassadors were willing to share were incredibly influential in our view of the digital divide and the impact of this project. One key takeaway was the experience with affordable internet options. Both Comcast and AT&T have internet options for $10 to $15 a month specifically for low-income residents that qualify by being eligible for food stamps or other government assistance programs. Our team was disheartened by the feedback that these programs often prey on low-income residents. The affordable internet is a “hook” to get people subscribed to the service. Then, as many ambassadors shared, the actual service is so poor that the internet is almost unusable. As such, they call to ask about an upgrade, which drastically increases the price. One ambassador said that with the extras she had to purchase in order to have internet fast enough to allow her daughter to use the internet for schoolwork, she is now paying $67/month. These lived experiences are incredibly enlightening. Our initial focus was trying to spread awareness of these programs for residents in need, but now we’re faced with larger questions about the efficacy of current low-cost options. This experience really showed us the necessity of citizen participation. When we consider the ladder of citizen participation, we feel like we’re stuck at the Placation stage. The ambassadors can advise, but don’t have decision making power. We’re considering how we can further engage all community members. On that note of community member engagement, an interesting historical example was brought to light at the meeting. The ambassadors recalled in 2016 when Google came into Mountain View promising fast, affordable wifi service available to all. However, the latency was high and the project was quickly abandoned, leaving the citizens disappointed and confused. While our project is more research-based and we don’t have direct decision-making power, we want to keep the experiences of community members at the front of our minds when considering policy recommendations. Critical Analysis/Moving Forward The focus group gave some great feedback about current resources. The hours of the senior center don’t cater towards those who work until 7 or 8pm at night. Some of the digital literacy classes in the library are inaccessible because of the language barrier. Overall, there was a really strong ask for more education. Paraphrasing an ambassador, she said that education about how to use the technology is almost more important than direct access to it. While she can borrow a computer or visit the library, because she doesn’t understand how to use digital resources, she is unable to consume any information from them. The importance of digital literacy and ensuring that adequate resources are available and accessible was really stressed. That being said, a majority of our survey respondents, as well as those whom attended our focus group, were older than 60. We’re also interested in learning how younger demographics interact with technology and the barriers that they face. As such, we’re going to hopefully be visiting the Mountain View teen center next week. The largest hurdle that we’re currently facing is a problem that we anticipated, the location data that our survey provides is not targeted enough to determine communities within Mountain View that do not have internet access. As such, we’re mainly relying on the ambassadors to distribute the survey to members of their community that do not have internet access. When we meet with our community partner this next week, we’re going to be focusing on strategies to engage with those without access. Update on Project Activities
Katie and Justin: We did our canvassing shift at the same time as last week, Thursday from 8 to 10 pm. We targeted Trader Joe’s and Safeway to get ahold of the folks who were working the night shift. We also stopped by Amici’s and Chef Kwan’s since we noted that there were quite a few workers in those establishments the last few times we canvassed. In total, we got around 8 surveys. We dropped off a stack at Amici’s and Chef Kwan’s and will pick it up sometime Sunday. Michelle & Shikha: Michelle and I did our Saturday afternoon shift last week as well as a Friday morning shift today with Yesenia. On Saturday, we went up down Santa Cruz Avenue as well as around a few side streets. We mostly talked to small business owners, managers, and workers (about 1 per establishment) and got about 7 surveys and 2 in personal stories. On the Friday shift this week, we went to Safeway, Staples, and a few small businesses in that plaza. We got about 15 surveys, mostly at Safeway, and 2 stories. Sarah & Yesenia: As explained in later sections in this reflection, our schedules could not align for us to canvass together this week. However, we both were able to get out into Downtown Menlo Park this week. Sarah focused on smaller storefronts in Downtown Menlo Park, while Yesenia focused on larger businesses like Safeway. Sarah was able to get around 10 responses on paper during her afternoon, opting out of using an iPad because the older demographic of workers/managers/owners in Downtown Menlo Park seems to be on the more technologically unsavvy side. Yesenia used an iPad in her afternoon in Safeway, as the overall demographic is on average younger and more adept at using iPads. Whole Team: We brought up the concern to our community partners that with our limited schedules and unexpected difficulties with getting folks to participate in the survey that we would not hit the 100 surveys that we originally agreed upon. Right now, we have conducted 74 surveys; We discussed what our final deliverables would look like again. Chris Lepe from TransForm suggested that we create a shareable blog post for us to make this information that we’ve gathered accessible to everyone, not just city council members. Given our current capacity, it may be something we look at if we finish our deliverables early but we want to focus our original final deliverables first. What We Observed and Learned In terms of connecting our work to the class readings, housing has a very expansive definition but a limited view in Menlo Park. Most people like the idea of affordable housing but are also attached to the idea of low-density housing, green space, and knowing your neighbors. Some in Menlo Park blame Facebook and Google for raising housing prices and pushing long-term residents out. Others say that even more than housing, traffic will push them out of the area. This week we learned about affordable housing in California and the history of public housing. Our project relates a lot to the topics we covered this week since our surveys are intended to assess the need of affordable housing in the area. Many of the people we spoke to during the survey talked about how expensive all of the housing was in this area and how difficult it was for them to afford it. They talked about the consequences: working longer hours, driving further, and paying more for rent, Michelle & Shikha: Friday mornings can be busy, but waiting for workers to serve all customers proved effective. People filled out our survey rapidly, and some even left contact information. People are really fed up with these issues in Menlo Park and were happy to take the survey. We had more lengthy conversations when going to smaller businesses with fewer workers. However, surveying at Safeway was much more efficient than on Santa Cruz Ave because of the density of workers. The difference in Safeway was that workers had less time to fill out the survey. A few still wanted to chat for longer but were wary of their manager nearby. The manager approached Yesenia and Michelle and told us to ask him before coming in next time. He mentioned that he paid his employees by the minute, so we shouldn’t take too much for their time. Still, it was a productive session and the workers were excited to help. Yesenia & Sarah: Making personal connections with people really helps get what you want! Sarah had a successful afternoon on Thursday with one memorable interaction with the owner of a luxury pet store. After having a lengthy conversation with the owner and building rapport, she gave me access to most of the workers during their breaks for additional surveying. The rest of the afternoon was spent in other shops along the Santa Cruz strip of Downtown Menlo Park as well as the side street businesses. 12:30-2:00 pm on Thursdays is a good stretch of time to interact with workers. Yesenia had a schedule conflict to go canvassing during the usual time so she ended up joining Michelle and Shikha Friday morning from 10:30 am -12:30 pm. She noticed a great difference between canvassing in a store like Safeway and a small, family-owned business in downtown Menlo Park. Because Safeway is a bigger, busier store than the small, family-owned businesses, the workers were more in a hurry to fill out the survey, which gave us less time to collect testimonies, but more time to survey other workers. The manager was also very wary of us asking workers to take a few minutes to fill out the survey because they are paid by the minute, as mentioned above. Katie & Justin: Night shift is a really hard shift to cover; people are at the end of the shift and ready to go home. We recognize that our survey is not a priority to them when they either have a family to get back to or a job to finish. Getting people to fill it out on the spot is a lot more successful than dropping it off and picking it up later. However, when it comes to businesses like restaurants, we want to work around their schedule and accommodate for their needs. If we had more time, we could canvass at different times where restaurants were in a lull (3pm-4pm or 10am-11am), but with the resources we have and the time we are able to dedicate, we had to coordinate some drop-offs and pickups. We do not think that we will have many responses, but the managers seemed to be interested, which is a good omen. We went into Trader Joe’s, in which we have had success before. We understand the night shift is hard to cover, but we were unable to capture Trader Joes in the last night canvassing session and we thought it was valuable to represent. I (Justin) spoke with the manager, and he allowed us to take surveys, but after I conducted one survey, he reconsidered his decision and cordially asked us to leave because they were busy closing. The manager told us to come back around 2:00 on a weekday when the last shift starts (so that we do not double count the same shift). We were able to conduct some Spanish surveys. I, Justin, personally enjoyed this because I felt like I could really connect with the person I was interviewing this way. I originally started in English (which I default to), but he did not speak the language. I could tell that he appreciated me speaking his native language. Also, in terms of data, it is important to reflect all languages to the best of our ability to avoid response bias. We encountered a Burmese man that we could not communicate with, but there is not much that we can do in cases like this. Critical Analysis/Moving Forward We may have to do one more shift of canvassing to get close to the target number of 100 surveys. We currently sit at 74 surveys, and we are hoping to reach about 90. Katie will go back to pick up a few paper surveys from restaurants downtown. Shikha will lead another shift. Our updated goal is 80-90 surveys. We met with the community partners again on Friday. They approved the outline for our final report. Our plan is to individually work on these pieces for next week, refine over Thanksgiving break, then meet with the community partners for approval on November 30. Broadly, Katie will be focusing on the literature review, Sarah will be writing about the project background, purpose, and methodology, Justin will work on survey analysis and data visualization, Michelle will compile stories, Yesenia will write summary descriptions of the survey data, and Shikha will work on compiling the powerpoint. In terms of data analysis, the response spreadsheet will require some amount of cleaning. For instance, some of the questions required respondents to select all that apply, so we will need to make dummy variables. Broadly, we will manipulate the data so we can study it. The community partners mentioned a few other potential action items. Adina wants us to meet with a business leader in Menlo Park to ensure that they are not surprised by the findings when it is published. We will likely be meeting with this person the Friday after our final presentation, then build our Letter. Update on Project Activities
This week, as usual, involved a lot of small 2-3 person meetings – most were focused on preparing good feedback for chapter editors but we also spent time discussing and finalizing our plans to engage with the oral history part of the project. Christian and Lexi submitted their two-page memo with feedback on the Migration/Relocation chapter to Mary on Sunday, November 4th. After Mary thoroughly reads this memo, the three plan to chat again to answer any remaining questions. Similarly, Tony and Spencer have been working on their feedback for Erin about the Speculation chapter, and Elise has been working on the Transportation/Infrastructure chapter feedback for Deland. Lexi and Tony had a check-in with Magie about the Indigenous Geographies chapter on Thursday, November 11th, during which they discussed what types of feedback would be most useful and strategies for editing down oral histories. Lexi and Tony were worried about inadvertently inserting our own voices over the interviewees’ based on how we edited their stories and what we cut out, but Magie showed us ways to shorten individual sentences without removing large portions of the narrative. Christian, Spencer, and Lexi also attended the Ethical Research Training with Magie and Adrienne on Thursday, November 11th. Tony and Elise watched a video recording of this training in their own time. We reviewed several pieces of literature, such as the AEMP handbook, prior to this training so we could gain further insight to AEMP’s philosophy of mutual benefit and using academia for activism. We decided, given our time constraints and lack of connections to people with direct experience of housing displacement on campus, not do an oral history of a Stanford employee (as we had originally hoped to do). Instead, Spencer, Lexi, Magie, and Adrienne discussed the possibility of doing some background research about campus housing activism to serve as a starting point for next year’s cohort of students. We may begin by conducting an informational interview with student members from SCoPE (Stanford Coalition for Planning An Equitable 2035). SCoPE is a student organization that cooperates with Stanford’s workers union on campus and advocates for equitable outcomes in housing, transportation, labor provisions and GHG emissions. We also scheduled a meeting with Magie on Thursday, November 29th to go over our draft educational materials, which we will begin developing next week. We are hoping to create something that will be useful for AEMP as well as for the 2019 Listen to the Silence Conference. We are also tentatively planning to send two people (probably Christian and Elise) to shadow Adrienne as she conducts an oral history interview in San Francisco some time late November. This is dependent on the interviewee’s schedule. What We Observed and Learned One of the main objectives this week was to provide feedback for each of the chapters we were editing, and we discovered that many of the chapters were at different stages of writing. We noticed that much of our feedback depended on what stage of writing the author was currently at, and that we all gave very different feedback to our respective authors. For example, the evictions chapter was more or less finalized and in PDF format, so most of the feedback had to be tailored to more specific, easy fixes that wouldn’t require an overhaul of the finished product. Other chapters like the migration chapter had basically no text or layout, and was a compilation of figures, graphs, and interviews. For a chapter like this, weaving a coherent story was more the focus in addition to providing criticism or suggestions about any data, and the team was focused primarily on finding common threads to link bits of the story together. Altogether, it was difficult to think about the overall design of the publication as a whole given that, currently, they are at such different stages in the writing process. Looking forward, it is important for us to make sure we know how our chapters fit together through discussion with ourselves and our authors. By discussing the big picture concepts from each chapter and how they fit together, we can better provide feedback for our individual chapter editors and create a more compelling finished product. We also clarified the expectations for our project deliverables while completing the Ethical Research Training this week. Our impression of the oral history component of the project was that we should reach out to any individuals or communities we knew of that might be interested in completing an interview, and that we would conduct an oral history ourselves that would be included in the Atlas or on the AEMP website. What we learned during training was that completing an oral history was not an expectation, but rather something we should try to accomplish for our own understanding of the meaning of ethical research, the importance of the project’s goals of collecting and compiling stories, and the impact of having the voices of people most affected by the housing crisis heard in our Stanford community. In fact, we might shadow one of Adrienne’s contacts while they complete an oral history, and this would effectively be achieving our goals of learning about ethical research while maintaining an appropriate level of participation. However, we are still interested in applying oral history work to workers’ rights on the Stanford campus. We do not feel as though we have the right knowledge and skill sets to create meaningful change in AEMP’s focus areas (San Francisco, Oakland, etc.), but we do know and understand Stanford’s community dynamics enough to get involved. Stanford is a major source of employment, as well as displacement, in the Bay Area, and AEMP has not yet begun to explore the stories of people affected by the institution’s regional dominance. Spencer had been to a SCoPE meeting earlier in the quarter and remembered seeing a map SCoPE compiled of the counties the workers were from – some several hours away. Clearly the problems we’d discussed in class around developers in the Bay Area not having sufficient incentives to build affordable housing, and lack of enforcement in ABAG’s Regional Housing Needs Allocation are reflected in the long commutes Stanford workers have to make to get from where they can afford housing, to where they have to work. Spencer, Lexi, Adrienne, and Magie began a discussion of what sort of work could be done on campus to help empower workers’ and motivate students to help push the university for workers’ housing. However, we believe that this work would require a lot more time than we have remaining in the quarter, so we brainstormed ways our group could help prepare materials for next year’s Sustainable Cities cohort. We are considering doing some preliminary research on Stanford housing activism to establish a “landscape” of what has been happening on campus and where there is room for AEMP/Sustainable Cities to get involved. Critical Analysis/Moving Forward At this stage in the quarter, we have been working with AEMP for quite a while, and have gotten a sense of the sheer complexity of the housing crisis in the Bay Area. As we have seen both in our field work with the organization and from readings in class, solutions to the housing shortage are not as simple as constructing more houses. Given legacies of gentrification, racial exclusion, and income inequality, the situation demands a holistic look at the issues affecting countless individuals in the Bay Area and beyond. This week was particularly informative in that regard, as it forced us to begin putting some of the Atlas chapters in conversation and begin drawing out the thematic arc of the text. The sheer difficulty of cohering a single atlas to depict the wide range of issues falling under regional displacement demonstrates the complexity of the issue at hand, as its narrative exists beyond single issues like AirBNB and the preponderance of Single Family Homes. Instead, each chapter has really begun to feel like single pieces in the collective “housing puzzle,” and conversations -- as working on chapter editing has shown -- are not relegated to particular sectors or even disciplines. They are complicated, interlocking, and often-times co-constitutive with other issues, requiring the earnest collaboration of all parties with something to contribute. Another idea that came up in this week’s readings that seemed especially relevant to the work we’re doing at AEMP is the idea of critical reflexivity. We were drawn to new metrics to evaluate urban change, as well as given case studies of several failed pilot projects, each of which providing context to many similar policies being debated today. Examples like Pruitt-Igoe and the high-rise developments following WWIgetting people off the streets and into better conditions, Pruitt-Igoe backfired, resulting in the proliferation of crime and “city-slums” throughout Saint Louis. This example seemed to be particularly poignant, as it forced us to consider practicality as much as ethicality, and to temper efficiency and moral exigence with reasoned analysis about how these problems might be solved. It also forced us to think about how space becomes amenable, safe, and accessible, especially with regard to development and changing urban landscapes. AEMP also exemplifies this goal, as their work on cutting-edge issues like “vacation rental homes,” and AirBnB seeks to problematize even superficially “unrelated” or even “beneficial” services. Perhaps most importantly, our work this week has provided us the opportunity to reflect on displacement not as a single act, but as an ongoing process of removal and erasure. During a conversation with Magie, we talked briefly about how settler colonialism resulted in the original theft of indigenous land. In thinking about indigenous displacement today, it became clear that colonization and displacement are not singular events with a defined beginning and end. Rather, displacement represents a logic that exists today in acts like the denial of indigenous sacred spaces, traditions, and family. Seeing social and physical location as the constellation of single acts has enabled us to think about these events in concert rather than in isolation, and be able to identity some of the persistent structural flaws inherent within the housing system. It has also enabled us to broaden our vocabulary when discussing events like eviction, migration, and racial displacement today. Update on Project Activities
This week, we took a step back from our sub-projects and examined the research questions we were asking. Some teammates were satisfied with their current paths of inquiry, but others had lingering questions that had been eliminated during earlier rounds of research planning. We also discussed how our colleagues at Hartnell had previously expressed interest in studying topics like mental health and public art, policing practices, and socioeconomic status in the Alisal. With Deland’s encouragement, we decided to reconsider these previously voiced ideas and invite team members to propose additional research questions through a shared Google document that we will reference during our Zoom meeting on Sunday. In the midst of this discussion, we also continued work on our sub-projects:
What We Observed and Learned One of the most gratifying parts of the research process has been finding so many great databases and archives. As we continue our research and ask more detailed questions about how we should define a “food desert” in the context of Salinas or how we can compare feelings of safety to crime metrics, we have often found resources that provide us with the demographic and spatial data we need, and in great detail. Our community partners, especially Krista Hanni of the Monterey County Health Department, have connected us with resources that will allow us to examine trends in the context of local government policies and even compare our findings across larger geographies. Critical Analysis As we reconsider our research questions, it is crucial that we balance feasibility with utility. We may come up with fascinating questions that could produce useful information for the City of Salinas, but we also need to come up with a well-defined plan to answer those questions within the few weeks we have left. It seems that many of the topics that most interest various team members are areas of expertise or past experience. For instance, Luis mentioned that it would be really interesting, and perhaps empowering, to research different types of public art and how those art forms influenced mental health. Luis also discussed his work with a local arts organization and cited instances of conflict between the city and artists. With this detailed knowledge of arts practices in Salinas, Luis could probably add this topic of investigation to the public health sub-project with little issue. However, trying to do a study on something like precisely tracking individual gang murders and tying them to historical events would also be useful to the city, but it would not feasible with the time and resources we have. Update on Project Activities This week, our group has mainly been working on finalizing and publishing the various formats of our survey. Romeo was able to translate the online survey on Stanford Qualtrics into Spanish to be used for online distribution via our various channels. Kelli also worked this week to create a one-page, double-sided paper version of our survey for later in-person distribution. She sent this to Alex and Christina and received their approval. Additionally, we set finalized our Spanish Speaking Ambassador focus group for November 7th at 6:30pm. Our largest project deliverable thus far, however, is likely the online publication of the survey. Since its online release on October 29th, we have had 143 responses, all of which were from individuals in households with internet access. The graphs below summarize the community’s responses to some of the most notable accessibility and demographic questions. 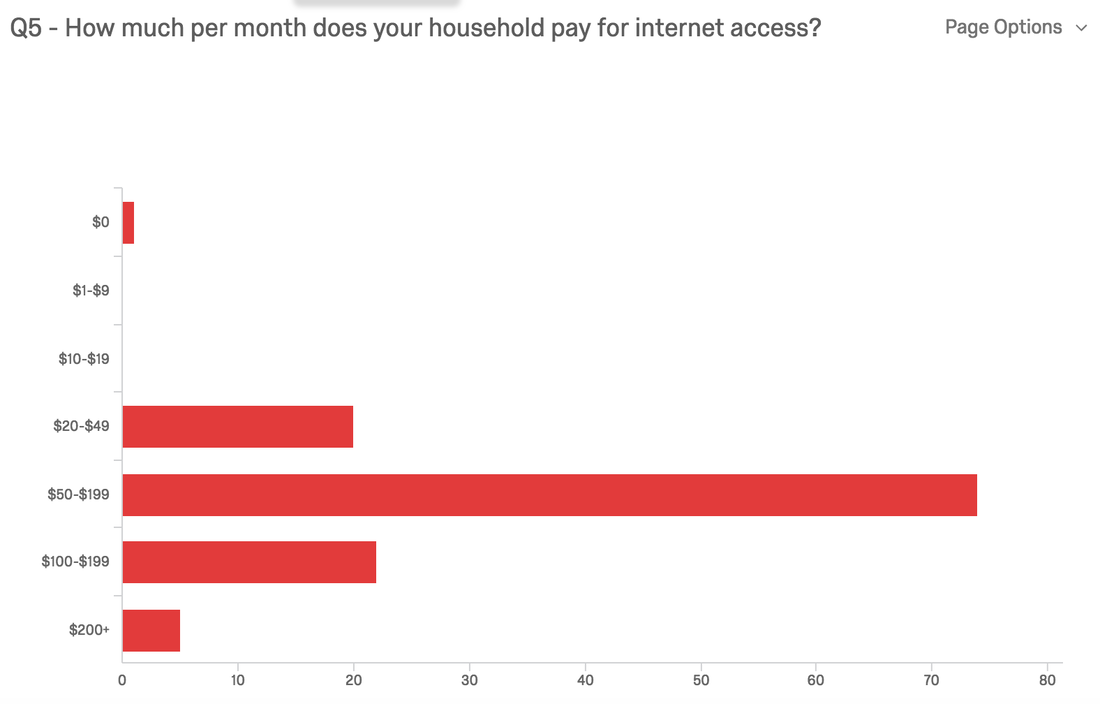 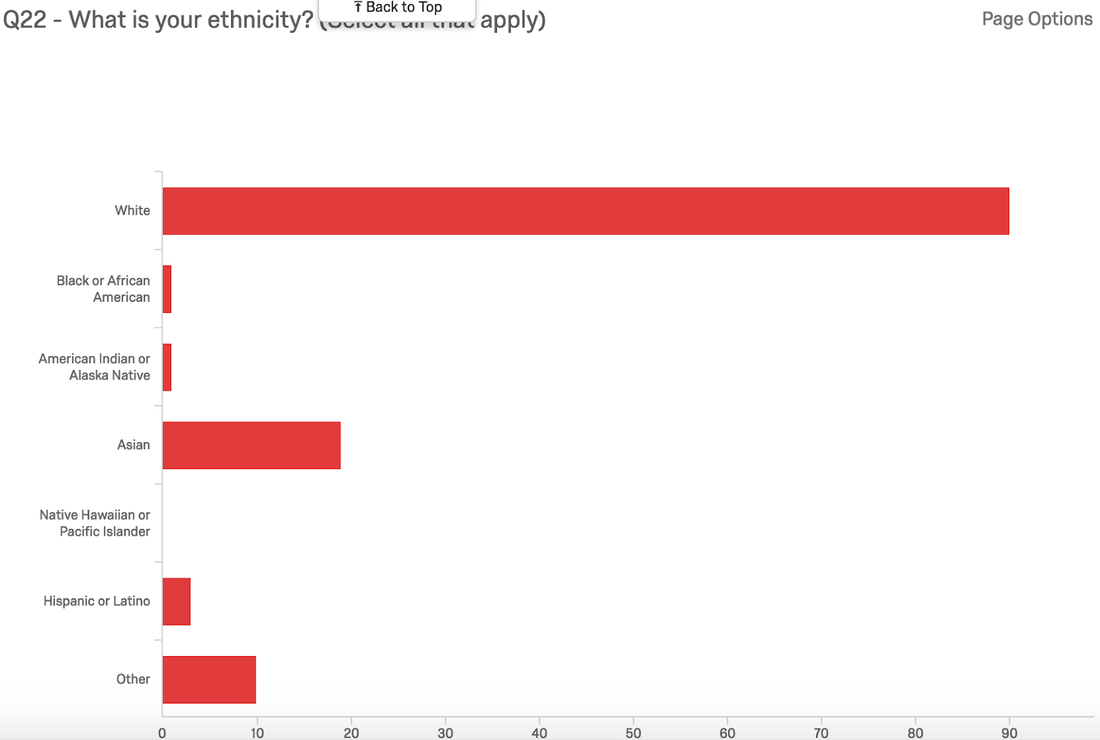 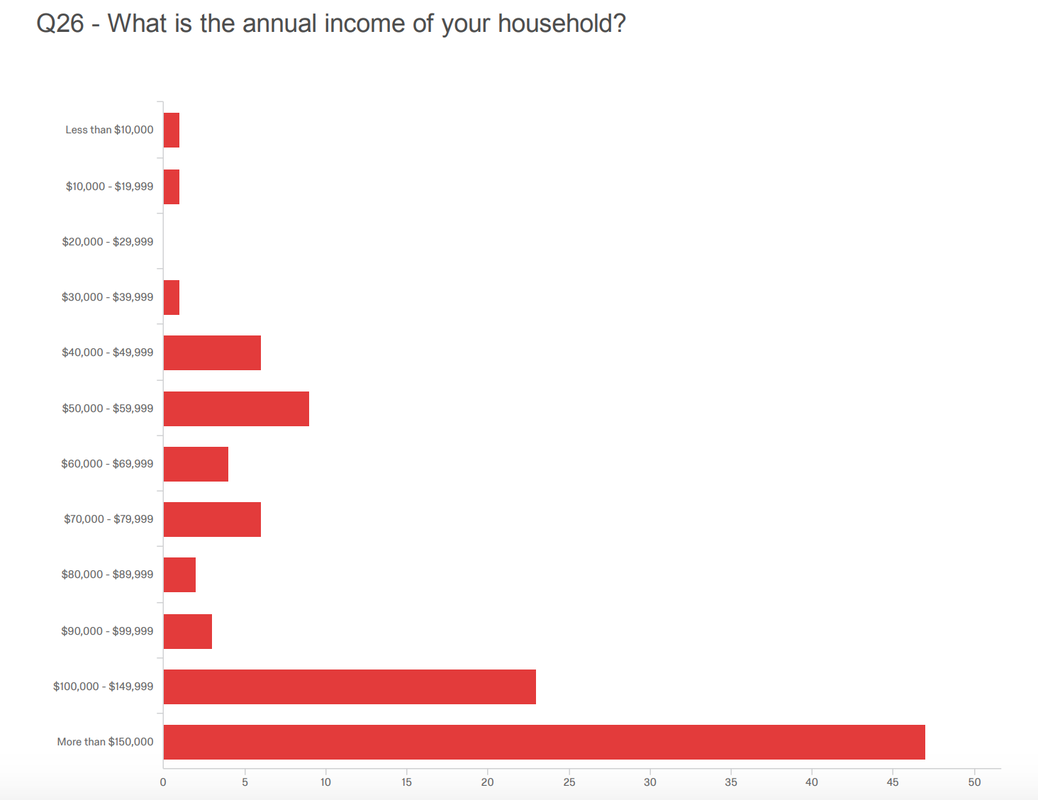 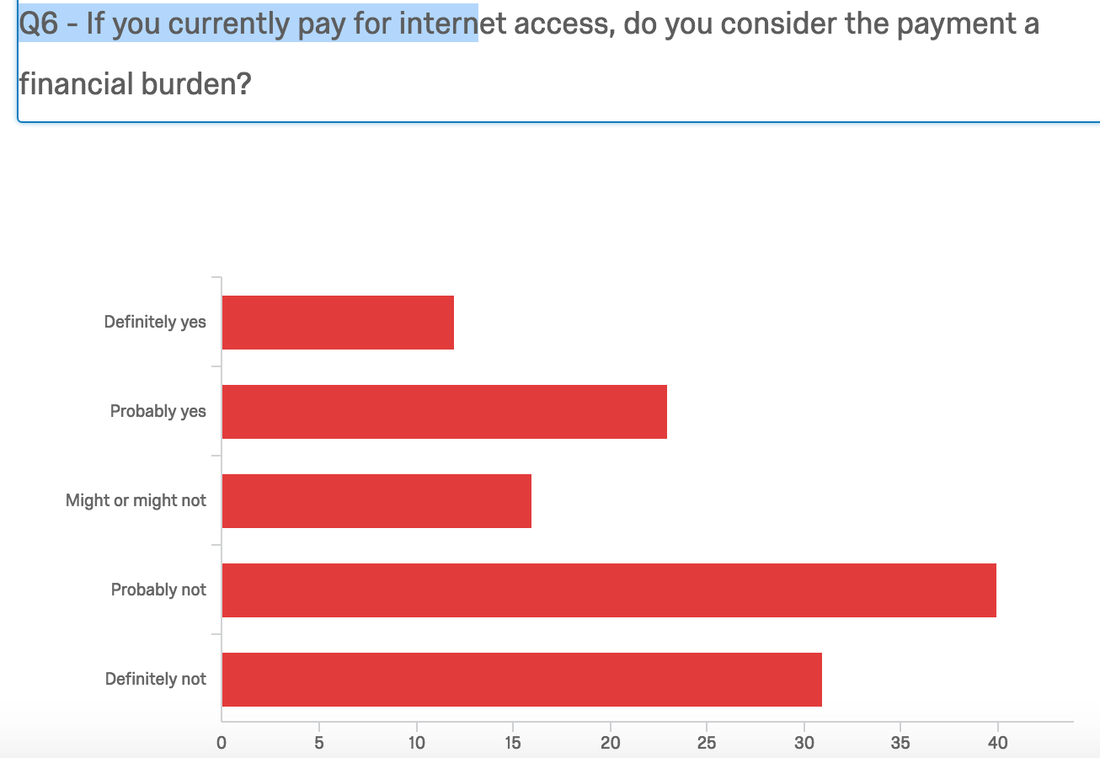 What We Observed and Learned
The article on the Red Hook Wifi Project was particularly interesting and especially relevant this week, considering we are starting to get our survey results back. One of the most interesting components of the Red Hook plan was their focus on providing non-mobile WiFi access, based upon their conclusion that most households accessed the internet via their mobile phones, not via computers/ wireless routers. Thus far, it is unclear how much this pertains to the digital divide in Mountain View, as a lack of internet access could also be attributable to a lack of access to hardware - phones, laptops, desktops, etc.- or a lack of digital literacy. According to our current survey results, 121 respondents use a traditional WiFi router, 44 use a Mobile Provider’s LTE, 19 use public WiFi, and 10 use some other form of internet access. There is also an interesting juxtaposition in regards to location. Red Hook, Brooklyn- a waterfront community fairly isolated by highways and waterways- was hit particularly hard by Hurricane Sandy and has been working to recover ever since. Mountain View, home to Google, LinkedIn, and Inuit is located in the heart of the booming tech scene and struggles to keep up with the pace of the growing industry. This brings forth the idea that the “digital divide” likely manifests itself in very different ways and subsequently must be addressed in different ways depending on the structure of the community. Ultimately, said issue, while national, is perhaps best addressed on a local scale. Critical Analysis/Moving Forward In terms of where to go from here, our major issue is probably the lack of diversity in survey respondents and, specifically, the lack of response from particular target groups of interest- the elderly, low income individuals, minorities, mono-lingual non-English speakers, and, most obviously, those without internet access. Each of these groups will require a different approach in regards to outreach. Surveying the elderly would best be done in-person at senior centers. The input of mono-lingual Spanish speakers will be included in next week’s focus group. Targeting the other groups will likely require the identification of on-site canvassing locations and in-person surveys. This is ultimately the goal for the next couple of weeks: utilizing the data from our online survey to identify areas of low-response and canvassing these areas to collect survey data. |
Archives
November 2020
Categories
All
|
 RSS Feed
