|
This week our team has been focusing on the best way to approach writing our final group report for our community partner. We have found reputable articles and outlined our paper. We want the paper to be both cohesive and consistent in our analysis of the two case studies. We did not realize how challenging writing a group report is, so this week in our team meeting we brainstormed various ways to write the paper. The first idea we came up with was assigning each person an aspect of the case study to focus on; for example, one person could focus on the economic aspects, such as incentivizing businesses to move into innovation districts, for both the Boston Seaport District and the Freemont Innovation District. A drawback to this approach is that the two cases are different and we don’t want to force a broad framework that may not necessarily fit or apply to the situation. The second idea we came up with was having two people focus on the Boston Seaport District and having the two other members of the team focus on the Fremont Innovation District. We are going to continue to discuss the best approach to writing the paper, as we add to our research and further develop our outline, but we all agreed that it would be best to meet to draft a conclusion and best practices section so that we can compare findings, discuss why the case studies matter, and relate our findings back to Milpitas. We think it is very important to synthesize our findings as a group, and make sure all of our perspectives are represented in the executive summary.
Next Friday, we are going to the Fremont Innovation District to meet with Christina Briggs, the Economic Development Director of the City of Fremont. We are planning on touring their district. Below are some of the questions we are planning on asking Christina:
On Monday in class, we visited the Stanford Educational Farm and heard from Ryan Thayer on what he learned from working with corner stores in the Tenderloin District. The unifying thread for our visit to the farm and our discussion with Ryan was food security. While, the development of an innovation district in Milpitas does not directly tie back to food security, the introduction of an innovation district to the Milpitas area does have the potential to impact the composition of the city, and thus potentially impacting the food landscape. On our visit to Milpitas, we noted that there was only one grocery store in the city, a bargain grocery store located on the outskirts. Alex pointed out the location of the Sunday Farmer’s Market and told us that many people buy their fresh produce from there. Additionally, many of the restaurants we saw were mom and pop shops and many of them also appeared to be run by immigrant families. While the main focus for our project, is not on food security, I think we can find ways to include this in our report as it is an important topic relating back to social equity, something our team is really interested in. Additionally, this is an important issue for the city to consider going forward, as it is important to make sure residents have access to healthy options; however, the city must be strategic to work with existing restaurant and grocery store owners, so that they do not cause local businesses to be displaced. Update on project activities
Today, we had a very informative meeting with Alexi. She walked us through the processes going forward for converting our transcripts into edited audio clips. We’ve also done a few things to move forward with the editing process and get us toward our deliverables. We have each created a folder in our shared drive to hold our transcriptions. This is where we will copy the text version of our transcriptions. During our transcription processes, we each highlighted sections that we thought we could potentially use in our final clip. We will also be adding these highlighted sections to our drive, and using that to work through creating a shorter clip. We are wrapping up our transcriptions and are looking forward to embarking on the editing process. Our next steps will be making the first stages of a script. Alexi explained that we can either approach this process as “parsing down” large blocks of text from the interviews, or we can cut-and-paste sections of the interviews to create some sense of a five-minute story. Once we have created a “paper cut” that is a rough cut-and-paste version of the text from our interview, we will send it to Alexi to get advice before we move forward. We will be in close communication over email, especially as we start the editing process. We will be using “free trials” for Adobe Premier to edit our audio clips, although we won’t start editing the actual audio until we get a final script for the text-versions of the transcriptions. What we observed and learned This week, we have learned a ton from our individual interview transcriptions. As we approach the end of the “transcription” part of the project, we are all reflecting on the content and power of the stories that we’ve heard. The stories are vastly different, and each draw upon different elements of the class. When beginning to think about how to create our edited clips, it is increasingly important to use the readings and frameworks that we have learned to make our “paper cuts” and then scripts. Alexi recommended that we draw upon “Problems of Editing First-Person Sociology,” and other readings that she will send out soon to help us with the process. We each got to talk with Alexi about how the interviews are sitting with us, and what sorts of themes they brought up. Thinking about themes and favorite portions of the interviews will help us find a jumping-off-point for the editing process. Critical analysis/moving forward Now that we’ve finished the transcriptions, our next step is selecting passage for our video. Compared to editing transcripts, we have a lot more liberty, since we choose which sections to include in our narratives and which to exclude. As such, we need to approach this next phase of the project with a lot more intentionality. We have several ways to approach the process of selecting passages. Are we going to include snippets of every subject the interviewees touch on, or should we try and select one or two topics and build a narrative around those? It’s likely we’re going to choose the latter because that provides for better storytelling, but then the question of which topics we will pick arises. Given the mission of our organization, we are going to pay special attention to housing moving forward, but any other themes should vary from interview to interview. For example, interviews with the African Advocacy Network, a Bay Area nonprofit that provides services and advocates for African immigrants, would include discussions about the experience of immigrants and the diversity in the African community. Once a topic is chosen, the ordering of audio is also a part of the process that deserves special attention. Many of the questions in the interview focus on trends. Is it preferable to focus on personal experiences of the interviewee, or broader trends that they’ve noticed about housing the Bay Area. All of these are questions that we need to consider as we move forward. Update on Project Activities
This week was spent largely on refocusing our scope and more clearly defining our approach going forward. With one month ahead of us, we aim to dedicate significantly more time actively mapping and putting the rest of the project deliverables together. In this regard, we have decided to split up the roles among ourselves for the coming week(s):
In terms of our progress on mapping activities this week:
What We Observed and Learned A recent study from MIT looked at the effect of lowering transit fares on lower-income individuals in the Boston Area. Their methodology involved giving 50% discounts off of rail fares for those who participated in the SNAP program and tracking their transit usage and destinations through daily text messages and CharlieCard (their version of a Clipper card) usage data. In their preliminary results, they found that discounted fares increased ridership by about 30%, and they also found that low income riders are more likely to travel at off-peak times and to use prepaid transit cards to travel. They also were found to utilize buses heavily and switch between modes often. The results of this study can help us to think about possible recommendations we can make after finding Communities of Concern which lack access. Another question we have asked ourselves over the course of the past week is, “What is ‘access’?” In thinking about the real life experiences of individuals “accessing” transit, it is unreasonable to believe that they can travel “as the crow flies” within a 3-mile radius of the Caltrain stations. Instead of this technique, we have used our network analysis tools to create an isochrone analysis of the reasonable distance a person can travel on existing infrastructure (bike lanes, roads, sidewalks, etc.). This better represents the routes that people can take to get from their Communities of Concern to transit stations, and it will give us a better understanding of which transit routes actually intersect with pedestrian routes. Critical Analysis/Moving Forward As we progress on our mapping analysis, we are looking at starting our final project deliverables. In order to ensure that our recommendations are accurate and impactful, we are working on developing a draft of our final project recommendations to relay to our community partners with the goal of receiving critical feedback to further develop our analysis. These efforts are in tandem with our continued work in GIS to find improvements for areas with Communities of Concern. With this wide breadth of area to cover and a decreasing, finite amount of time with this project, further coordination with our project partners is required in order to cater to their needs - this coordination will be especially useful in case the deadline becomes a pressing concern, helping us narrow down our scope of work. One area that our team is hoping to incorporate as a part of our final deliverables is the integration of general commute patterns on the Peninsula. This examination of the usage of existing transit options in the Bay Area may help us gain some perspective into which areas of the Peninsula experience a gap in available transit solutions and provide recommendations through that analysis. This, and other analysis efforts, need ridership data from SamTrans since it is one major transit provider in the Bay Area. Although this data is not open source, we have contacted some connections at SamTrans and hope to have data for GIS analysis soon. In the wake of the final written report, we have started allocating our roles to complete the writing. After a team meeting this past week, we recognized that our team members specialize in different skills - those who are less proficient in GIS analysis are looking forward at portions of the final report that require more research and writing work, such as the Literature Review and synthesizing the Project Purpose and Methodologies. Reallocating this work helps prepare our group for the increasing amount of work in the final weeks as our project winds to a close. Update on Project Activities
Last week, we completed our Scope of Work and set our timeline and goals for the rest of the quarter. As Week 5 comes to a close, we are continuing to evaluate our progress and assessing the feasibility of the work we set out for ourselves. We have observed ourselves, for example, spending more time creating a workflow to analyze transit data for all transit systems rather than working specifically with SamTrans, VTA, or MUNI data. We are realizing that a presentable final product is only partially the methodology, and that to remain on schedule for producing results, we will have to spend more time in the next few weeks than planned. However, we have developed a solid intuition of how to actually apply techniques like “isochrone analysis” (service area) to our transit and bike datasets using the tools we have access to. We will focus in the coming weeks on leveraging these new skills to multiply the number of our conclusions we have made thus far. After receiving comments from Deland, Adina, and Ian on the Scope of Work, we have spent some time discussing how to implement the feedback. Specifically, we need to think more deliberately about our Project Definition and Seeing the Big Picture sections. Deland raised many important questions that are challenging us to think critically about the choices we are making in our project, which will guide us in our further analysis and what data we choose to include in our mapping analysis. On Monday we spoke with Adina and Ian about our progress and next steps. They were pleased with our Scope of Work and timeline for the rest of the quarter. We updated them about our GIS mapping analysis and provided our first recommendation: there is one community of concern, located in San Bruno, that is completely unserved (in any part) by SamTrans Caltrain connection bus routes, posing an accessibility concern. Our next step is to put this recommendation on Story Maps (to avoid leaving Story Maps until week 8, as Deland brought up in her comments for our Scope of Work). Together, we established that by our next meeting on Thursday October 31 we will have completed analysis to present 2-3 recommendations for policy to improve Caltrain access. We believe this is a manageable goal to complete over the next week, especially with the learning curve to use Story Maps and how to present our recommendations. We have also continued collecting GIS layers for bike lanes (all three classes) and streets in San Mateo county. After meeting this week to work on GIS together, we were also able to complete a network analysis of the collected bike data to see what areas are bikeable via a max 3-mile trip from a Caltrain station, looking next to integrate our elevation data. We still have a lot to learn about network analysis and other commute data that Deland directed us to. In the meantime, however, we have made use of ESRI’s plentiful tutorials on their software, and have reached out to staff at the Spatial Analysis Center for further resources. The Transportation Commission activity in class was actually seen as an insightful exercise on where our recommendations might end up: being presented to the City of San Mateo to improve equitable Caltrain access. It is thus important that we are able to present them in a coherent and visual way, backed by our data analysis of who will be benefiting and highlighting very specific changes we are advocating for. What We Observed and Learned As we progress in our analysis, our community partners continually provide us with more useful resources which help us with our conceptualization of this project. One project currently ongoing in the Bay Area is extremely pertinent to our project: Caltrain is conducting an equity analysis as part of its Business Plan as part of its mission to make its services more accessible and attractive to the general community. Additionally, SamTrans is conducting a Comprehensive Operations Analysis to review and improve its routes. As part of a mandate from the Grand Jury report, this initiative is attempting to improve its connections with Caltrain. These two transit organization-led initiatives are directly relevant with our mapping analysis. Our group cannot help but notice the similarities between our work with the Friends of Caltrain and what these transit agencies are currently aligning themselves with doing. Hopefully, these aligned missions mean that our recommendations are received with a real hope for productive modifications to public transit routes. Critical Analysis/Moving Forward As we look ahead to week 6, our primary goal is to continue implementing layers as defined by our Scope of Work. The layers and their details are as follows:
As we discussed with Adina and Ian, we need to spend this week curating a batch of recommendations that they will review and give us feedback on by Thursday. We agree that it is best to first receive feedback before moving forward with more analysis to make sure that we are on the same page with our analysis methodology and the quality of the recommendations. Strong and clear data visualization will be essential toward making our case. Ian is an expert at visualization, so we are eager to hear his thoughts on how we can best achieve our goals of communicating our recommendations successfully. We also hope to start working on our final report over the next week. While we currently have not finalized any recommendations with our community partners in order to include them, we can still begin assembling our introduction, literature review, and summary of ongoing initiatives to educate and influence the community about public transportation. 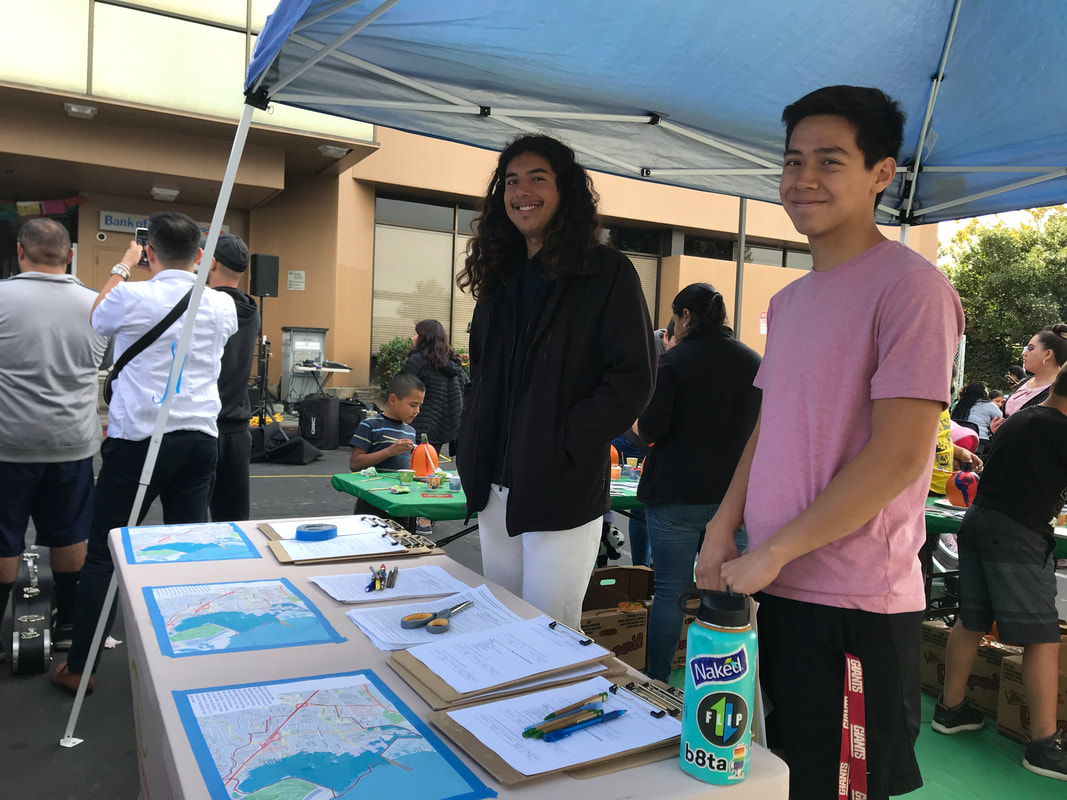 Update on Project Activities
During the past two weeks our team has been doing survey work in the field at various community events. On Thursday afternoons we’ve been working at a food distribution event at the Mouton Center, and last Saturday we worked at the Latinx festival at the East Palo Alto Library. We have been fortunate and grateful that the Acterra team has taken on the digital inputting of the paper surveys, so we have been updating our spreadsheets with the new data. The key data points that we wish to investigate are climate change awareness in relation to age, ethnicity, and response language. What We Observed and Learned The opportunity to do surveying fieldwork has been a really valuable learning experience for our team. I think we all realized that surveying is much harder than it seems and now further appreciate the time and efforts it has taken just to gather the existing data we have so far. The biggest challenge in surveying is asking people for their time. The survey is rather long and involved and it is an inconvenience for people to sit down and take it. Furthermore, we have realized the importance of language in connecting with people and helping them feel comfortable. For example, on Saturday we were surveying at the Latinx festival and many of the people there were Spanish speakers. Brian is the only native Spanish speaker among our group and he was able to talk to residents and persuade them to take the survey much more easily than Steven and I could. I pushed myself to try speaking Spanish and had limited success. I think it does help people feel comfortable and trust you when you approach them in their own language. Throughout the surveying process we have been continually changing and adapting the survey to improve it. We received feedback from the climate change community team that community members are more comfortable with using paper surveys because of unfamiliarity or distrust of technology, so we have transitioned to paper surveys at all our events. We have made note of specific areas in the survey that often get skipped and make sure to double-check that respondents fill out those sections. We also observed a need for Chinese translation in the survey materials, specifically with the group of people who attend the food distribution event. The main takeaway from our survey work is that it requires patience, community awareness, and meticulous double-checking. If a certain part of the survey is not completed, that could render the data unusable. As a result, we’ve also had to spend a good amount of time bothering people to come back and fill out the survey correctly. Critical Analysis and Moving Forward This weekend, we will be attending the adaptation planning meeting with East Palo Alto community groups and surveying at another food distribution event. This will be one of the last survey opportunities and we hope to make significant progress on our goal of 400 responses. We have a plan for how to proceed with the data analysis, and we hope to jump right in next week and begin spatial analysis by coding the survey addresses into GIS format through georeferencing. We will also work in Excel to sort through the survey data and find relationships between climate change awareness and age, location, and ethnicity. We will have to make decisions about which awareness metrics to use for this. We will need to check in with Derek again in the next few weeks to get a little more guidance and direction for the data analysis. Looking forward, we should continue to keep the principles of ethical and participatory research in mind, prioritizing the needs of the community in our work. This week's Wednesday class about zoning laws and CEQA was very applicable when thinking about East Palo Alto and I think we should definitely keep these considerations in mind in our work. Just being in the space, we can observe how city planning might have failed the needs of residents. For example, university avenue runs right through the city and the road is extremely busy and congested during traffic hours. We even observed signs in residential neighborhoods that said "no commuter traffic 4pm-7pm" because I imagine commuters would try to drive through residential side streets to get around traffic. This is definitely a huge environmental quality issue for East Palo residents, and although this is outside the immediate scope of our project, I wonder what work we can do around this issue. |
Archives
November 2020
Categories
All
|
 RSS Feed
