|
During our transportation week, our class went on a guided bike tour with Stanford Transportation staff to learn more about the sustainable transportation planning taking place on campus. We visited the Marguerite electric bus yard, discussed recent pedestrian and bicycle safety improvements, and learned more about the nuts-and-bolts of planning, designing, and implementing this infrastructure. Many thanks to Ariadne and Tony! 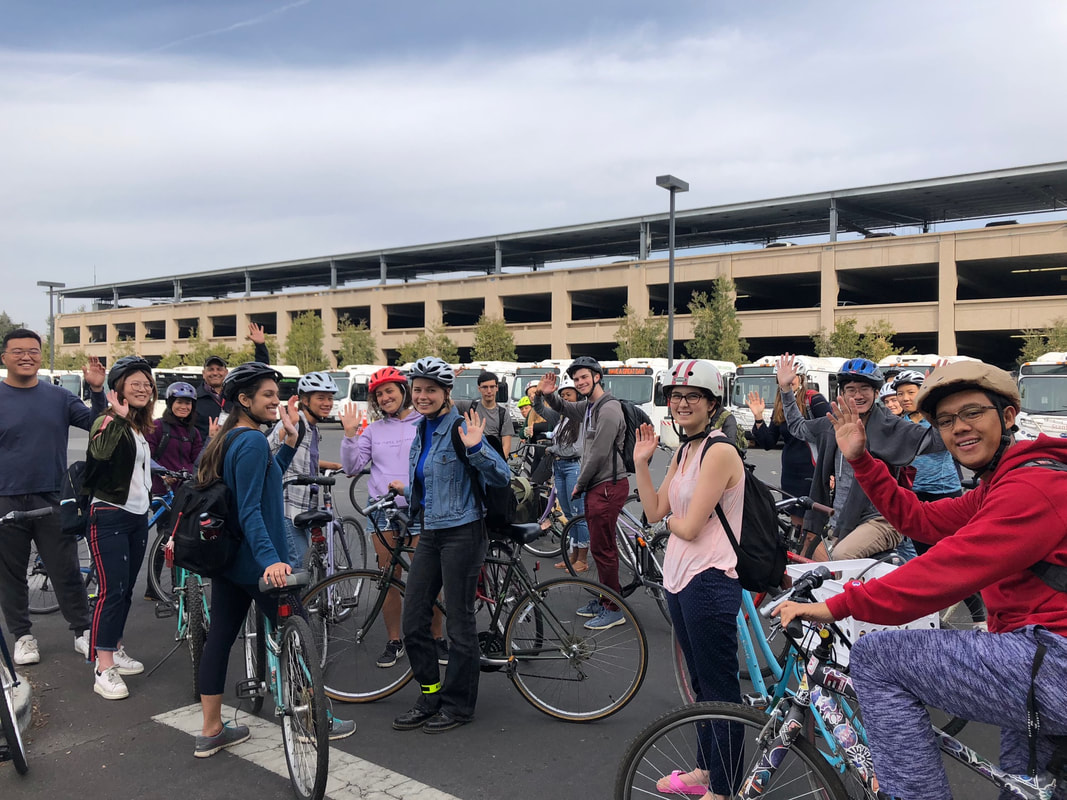 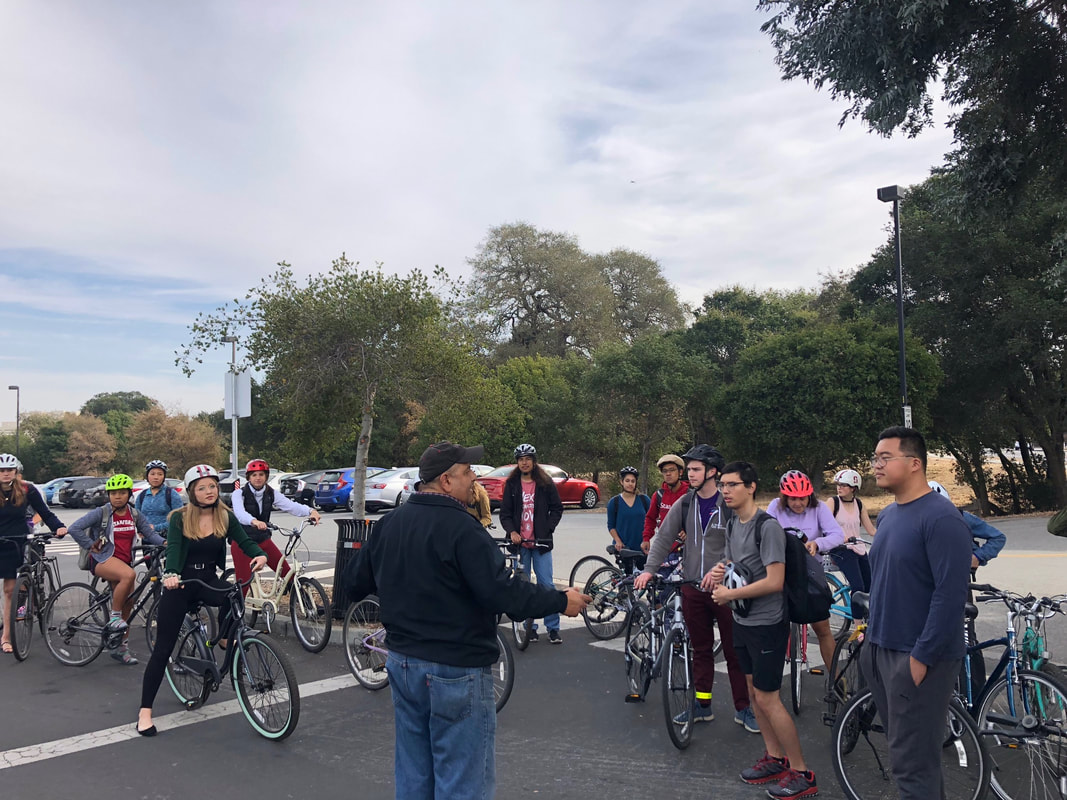 Update on Project Activities
Last Sunday, we had another full team check-in meeting and discussed the progression of our research. Many sub-project teams had gathered most of their data through interviews, literature reviews, and combing through public data portals. As we continued to analyze all we had collected, our thoughts turned to deliverables and the big picture. In class, we chose which sub-project elements will be displayed with maps and started to think about other formats as well, including charts and infographics. On Friday, Hannah and Jose discussed the progress of the Stanford and Salinas teams and clarified a few communication issues. Here are some more detailed descriptions of our sub-project activities this week: - Public Health: For our sub project, we have covered a wide range of items. First, I was able to establish definitions for food desert, mental health and art. For instance, food desert will be identified via mapping by understanding the incomes of certain communities through the census data. According to the USDA, the root of food deserts is due first by community poverty, meaning certain areas may not have the funding to bring in or continue local businesses. I think this is a wonderful lead to go off of. After establishing the definition, I needed to understand the geography and basically the location of Salinas a little more. Using something as simple as google maps and other online USDA maps, I was able to see the general areas of homes and their proximity to places of agriculture. For example, many of the areas of agriculture are not directly within communities but may surround urban areas. I still need to continue to identify where there are green spaces within urban areas. Interestingly enough, there have been studies/efforts to create community gardens as a way to combat food deserts. However, again I need to establish where. Addresses at this point are important for me to keep track off so that I can relay them to another partner to be mapped. Lastly, my partner has done interviews about mental health, and overall public health. He is working on contacting the arts council about digitizing the art murals around Salinas and providing the data about the artists. Hopefully we also try to understand if the are art organizations and how close they are to urban communities. Some future things could include contacting: 1. Mosquito Abatement might have the information on parks and geography. 2. Salinas Parks Master Plan from previous years. Crime: Segregation: I spent much of this week getting my ArcMap segregation model to work. I had set a goal at the previous weekend’s check-in meeting of making a functional model, and I’m happy to say that this was more or less accomplished. The model allowed me to input the deviational ellipses I had generated for each racial group and get a segregation index for each decade. I also started collecting data that I can use in a correlation analysis of segregation, including GINI indices (income inequality) and data on age, educational attainment, and language fluency. To learn more about geospatial resources on campus, I also attended GIS Day. Speakers discussed interesting topics like drone mapping and AI, but they also provided information about more accessible resources like EarthWorks, an inter-university map and geospatial data repository. Transportation: What We Observed and Learned Now that our research questions have finally solidified and the final presentation is fast approaching, we realize that we must figure out our deliverable formats sooner rather than later. In some cases, our findings can be easily displayed, like mapping food deserts or showing images of local murals. However, some sub-projects deal with incredibly complex issues that are not so easy to depict. Additionally, we have improved our communication skills by discussing and explaining the technical details of our sub-projects. In this project of projects, it is easy to get stuck in one’s own silo and forget to explain technical terms and methodologies. By checking in with each other regularly, we are forced to practice explaining our research in more accessible terms and to think about how our sub-projects fit together. As some sub-project teams continue their literature reviews, they have found interesting issues that link their sub-project to others, proving how interconnected urban issues really are. Lastly, Anpo noted that keeping a running document between partners is a great way to stay consistent with communication and updating articles. Critical Analysis The lessons we have learned from intra-group communication issues, while frustrating, will be incredibly useful if we apply them to our presentations. One of our presentation audiences is intimately familiar with the city of Salinas but may not be familiar with the details of demographic/spatial research, while the other audience is made up of academics and urbanists who may never have even visited Salinas. In both situations, we will need to clearly and concisely explain unfamiliar topics or methodologies without compromising our findings. Many of our in-class lectures have detailed similar challenges that urban planners face, like communicating with linguistically diverse residents in San Francisco or discussing the financial pros and cons of flood mitigation with local business owners. As we prepare our presentations, it is critical that we include explanations of acronyms and technical terms, geographic and historic context for the city of Salinas, and easily readable graphics. Beyond these considerations, one of the best ways we can prepare is to try to anticipate which questions the audience might ask and prepare to answer them in detail. For now, we are keeping on with our research and it is extremely fascinating to learn how much all of our sub projects rely on one another. Update on Project Activities
This week, we were able to make great progress in the planning and collection of interviews. Since our last reflection, we have interviewed Mike B. who is the Development Director at Sunwork - a non-profit organization whose mission is to help make solar more affordable and widespread with the help of trained volunteers - and he is also a member of Carbon Free Mountain View Board which meets regularly to discuss and advocate for a more sustainable Mountain View. We also interviewed Jessian C. who runs a blog called Fun and Draconian where she writes about fun ways to live a greener lifestyle. Jessian also manages SF Approved, a site of green products she helped create at San Francisco Department of Environment. Lastly, Jessian serves on the board of the Earth Island Institute, which has been the organizing power for more than 200 grassroots environmental action projects and is currently overseeing a network of more than 75 projects. On Friday, November 16th, we are talking to Laura M., a board member at Canopy - an organization whose mission is to plant and care for trees in urban communities who need them most, often working with communities in East Palo Alto. We are still communicating with several other individuals, in the process of scheduling interviews for this weekend before break, and a few days throughout the week after the break. We are also meeting up with our community partner, Danny on Friday, November 16th, who conveniently happens to be driving past campus in the afternoon. This meeting will most likely serve as a check-in, and we are hoping to share a few of the stories we have collected so far as well. What You Observed and Learned Now that we’ve been able to conduct more interviews and get more raw audio stories, we are able to look back at what voices we are giving a platform to and which voices we haven’t yet done so for. We currently haven’t been able to interview low-income Bay Area residents, which is alarming considering low-income residents are the ones who will primarily lack the resilience and mobility to evade and recover from the effects of climate change. For example, the wildfires that are devastating California at the moment will most impact low-income residents who lack the financial means to escape from the smoke (due to strict work conditions) and lack the capital to simply purchase a new home. As we conduct our last few interviews, we should be cognizant of how we have been reaching out for possible interviews in order to best find sources from low-income residents. Additionally, we have encountered our first more emotional interview with Mike B. as he discussed the effects climate change could have on communities in the Bay Area if we fail to mitigate climate change. Although the interview didn’t have him emotionally distressed, it was an important reminder that we should always be cautious when seeking out stories about how climate change could directly impact an individual. It is easy to forget that at the end of the day, these events were personal and harmful to those we are interviewing, and we should always prioritize the mental well being of our interviewees before anything else. Finally, this week we had our meeting with Danny to discuss how much work we have accomplished and yet to do. This meeting came at a perfect time considering our group has been discussing how to reevaluate our relationship with our community partners, Danny and Michelle. Because they have offered their time and energy to take some of the work off our shoulders, we’ve talked about how this may best look like, whether it's through scheduling interviews or conducting them. During this week’s meeting with Danny, he reassured to us that if there is anyway he can help us out, to just tell him. We agreed to share the raw and edited versions of our interviews with him during Thanksgiving Break so that he can give us constructive criticism in our edits. Finally, we spoke to him about our financial constraints when traveling around the Bay to gather stories, and he offered his car and museum funds. This meeting helped concretize ways in which our community partners may help us, and how we can continue approaching them when requesting help. Critical Analysis and Priorities for Moving Forward As the quarter comes to an end we plan to finalize our project deliverables over Thanksgiving break. First, this weekend before leaving we will be getting at least two more interviews from IMMA. Then, throughout break we will each be individually working on the editing of the interviews we have so far. We have all downloaded Hindenburg and received a tutorial on how to use it by Cameron. We hope to collect a minimum of eight audio deliverables to be used as stories in the map at the tech museum, by the end of the week. Following this, we will return to campus and finish our last set of interviews. Ideally, we will be interviewing the last six people we need. This would allow us to reach the set goal of 14 deliverables. We are aiming to hit this number but if we are unfortunately unable to, we will prioritize quality of stories over quantity. We would edit quickly after on Hindenburg in order to be able to present all the deliverables on time together. Finally, we will be meeting on Monday evening, day one of week ten, in order to review the audio stories we have each edited, propose a plan for our final paper, and ultimately create our final presentation and begin to review in order to be prepared for the formal presentation on December 5th. Update on Project Activities
On Tuesday, Shikha, Yesenia, and Justin met to collect more surveys and bring us closer to the Menlo Together goal of 100 surveys. We canvassed for 1.5 hours, targeting both stores we had already canvassed before, during different work days/hours, and new stores that we had not seen. Justin thought that we should especially focus on Trader Joe’s, as it has many workers in a centralized spot, but the manager said we could not interview workers inside of the store. Yesenia and Justin visited other stores along Escondido road. In total, we collected 7 surveys. Meanwhile on campus, the team met during class on Wednesday in the d.school to start working on final deliverables and sorting through the collected data. What We Observed and Learned Shikha, Yesenia, Justin: For the last shift, Justin and Yesenia planned to go to Trader Joe’s, where our group has previously had success, to cover a different shift. Justin talked to the manager, and he did not want us there, despite the fact that it was an off time for them, and a week ago, a different manager told our group to come back at this time. To fill the shift, we had to find alternative places to canvas. Justin and Yesenia walked down El Camino and Escondido Road to any small businesses that had been missed by previous shifts. As this was our last shift, we had already covered the easier businesses. In most of the small businesses, there are not many workers, and the workers present are busy, so these are hard to canvas. We went to Safeway and were permitted to survey, but every worker was busy. In total we received 7 responses (we struck out many times). However, after this experience, we came to the conclusion that we have covered all of the businesses that were willing to talk, serving as a natural end to our study. This is useful information for our survey because it shows that we represent Menlo Park businesses to the extent that is possible. Justin: During our Wednesday meeting at the d.school, I “cleaned” the data so that it is in a format that we can study. This involved creating dummy variables for the modes of transportation and incentives people would want for public transportation. Sarah: Even though I did not canvas this week due to sickness, I worked on starting to fill out the final write up during class on Wednesday and work on the weekly reflection remotely. Critical Analysis/Moving Forward Shikha, Yesenia, Justin: At Applewood pizza, one of the workers declined to fill out the survey, stating “Oh, I know none of that” in Spanish. Yesenia tried reassuring her, in Spanish, that the questions on the survey were simple, like ‘how many minutes does it take you to get to work’. However, she remained unwilling to fill out the survey and we thanked her anyway. We were interested in seeing how the language barriers and even literacy could play into other canvassing interactions, but as Tuesday was our last day, we no longer have to worry about that. Still, it is important to consider we are considerate of literacy challenges or things that may dissuade workers from filling out a survey. Reading between the lines, it is possible that such a response is to avoid saying “I am unable to read the survey,” or perhaps to more politely decline to take the survey. In either event, we cannot force somebody to take the survey if they do not want to, as this would undermine our integrity as surveyors. Justin: We can use some of the graphs that were automatically generated by Google. However, for some metrics, we will want to study responses with respect to race or income, or compare metrics in new ways that present illustrative conclusions. Reading Reflection This week we were assigned readings extremely pertinent to our particular project. The SPUR Report worked on breaking down the transportation patterns, needs, and recommendations for the Bay Area and Alex Schafran’s “Silicon San Francisco, and the West Bay” focused on the urbanization (and lack thereof) in Marin County. The SPUR report deals with more of the findings and literature we have come in contact with in our work with our community partners. The way that the writers decided to put together the publication in terms of the figures, colors, and headings was very visually pleasing, and we hope to be able to incorporate aesthetic ideas from that report into our final deliverables. In their introduction, they state “the Bay Area has more than two dozen different public transit operators—and yet only 3 percent of all trips here are made using transit.” That statement is something that we probably would not have expected before our group work started, but now makes more sense as we have canvassed and increasingly seen trends that people from all socio-economic brackets tend to drive to work alone. To us, that means that a lot of the public transportation options are inaccessible because they are so disparate and sometimes illogically planned that it makes using multiple types of public transit untenable, to the point that driving alone in a car through hours of traffic is more helpful. We hope that our project can address this fatal flaw in the public transit system in Menlo Park, and hope that the findings of the SPUR Report as well as their recommendations can be seriously taken into account. It can be done with effort and money, as evidenced in London’s updated transit routes that are now widely used and accepted and touted as being one of the best laid out plans and easiest ones to understand. Switching to the second reading, Schafran’s “Silicon San Francisco, and the West Bay,” focused more on Marin County. Historically, the area has been home to extraordinarily wealthy people in search of a quiet and nature-centric location to settle down. To that end, as evidenced by the Schafran article, there was quite a bit of pushback regarding urbanization of West Marin (aka the 1973 Plan). The article even states that “at virtually every turn, efforts to combat the unnecessary urbanization of West Marin were innovative, aggressive, and progressive.” These innovative approaches took the form of environmental protection rather than equitable living and social equality. By hiding under the guise of protecting the natural beauty of Marin County, the already well-to-do residents were able to subvert most efforts for urban development in their bucolic mansions on the hills. This parallels a little bit of what we have seen in Menlo Park: there are wealthy residents who do not welcome new change in their traditionally well-off and well-to-do area, pushing back on the idea of welcoming affordable housing to their area. For example, the financial barriers in Menlo Park like the average monthly rent for an apartment being $3500. This has traditionally made low-income families unable to move into these neighborhoods, leading to issues such as long commutes for the workers in the area. However, in 2008, Schafran documents that Marin County passed a “countywide measure to fund transportation improvements. The major provision of the bill was to fund a commuter train, the Sonoma-Marin Area Rail Transit (SMART), between San Rafael and northern Sonoma County.” While this seems to have been some sort of panacea, it was not. Schafran goes on to say that even with all the money funneled into transit, there would still be a disconnect. It all goes back to Marin County’s reliance on the environmental versus social good fight. Thus, there is precedent of good ideas going to waste. Unfortunately, our group does not have the bandwidth to see our project all the way through and make sure that our recommendations make actual change in the long run. However, since there is a history of money going into transportation and not getting used in the proper ways, our team will focus on emphasizing the benefits of including affordable housing and better public transportation in and around Menlo Park. Because we can identify and call out communities like Marin for what they are doing, and because we can see the flaws in the public transportation sector and examples of how to fix them, we should do what we can to ameliorate the situation in the Bay Area. It starts with baby steps like Menlo Together’s work on trying to understand the commuting patterns of low income workers in Menlo Park and their quality of life, and it ends with actual change on a city, regional, state, and maybe even national level. Update on Project Activities
This week we were wrapping up all of our final data collection. On Sunday, we met with our community partners, Alex and Christina, to discuss the best ways to survey the areas less-represented in our online survey. We decided to go to the Teen and Senior Centers to interview the people there, as we hypothesized that older and lower-income individuals would have the lowest frequency of digital accessibility/ connectivity. On Tuesday, Kelli and Katherine visited the Senior Center about an hour before their most frequented weekly event: free lunch. While they remained there until the lunch began, most of the seniors were (a) not willing to answer their questions or (b) didn’t speak English. Neal and Kendall’s trip to the Teen Center yesterday (Thursday), however, was a bit more successful, as the teens and children were very willing to answer questions, though they often didn’t seem quite as knowledgeable about their family’s plans and internet accessibility. We talked to about 13 teens, from middle- to high-school aged. They answered questions about internet accessibility and speed, their family and friend’s usage patterns, and the devices in their household. Moreover, the staff of the Teen Center agreed to posting a link to the online survey on their instagram. In our meeting with Alex and Christina, we discussed the plan for after break. We have a meeting planned with the Community Services Agency (CSA), a non-profit organization based in Mountain View, where we intend to present the preliminary results from our findings. Additionally, Alex and Christina agreed to one final push on the online surveys via their social medias: Alex via the twitter for Mountain View’s economy and Christina via the same three social media channels as before: NextDoor, Twitter, and Facebook. What We Observed and Learned The difficulties we encountered at the senior center were particularly interesting, as they really helped to shed light upon some of the difficulties with surveying. While we weren’t able to collect concrete data, the presence of many monolingual non-English speakers could have been indicative of a lack of either digital accessibility or literacy. It would be interesting to brainstorm ways for future analysis of such an important target group. The visit to the teen center was also very enlightening. Most of the teens seemed to come from a similar background: relatively low-income, Hispanic families with a large number of residents. While only one of the 13 children interviewed didn’t have internet access at home, several of the children expressed the limits on time and speed of their wifi. Much as we learned during the Spanish Speaking Ambassador Meeting, the majority of individuals, regardless of their wifi connection, have numerous devices. In terms of usage, most of the kids said they mainly used the internet to play video games or watch youtube, with only a few indicating that they use it for homework. In regards to the latter, many of them explained that their schools often provided them with chromebooks to do their assignments in class or on the premises. In terms of digital literacy, a few of the kids told us that they often had to help their family navigate the internet or use their devices. While the kids all had their own phones, it was fairly rare that they had both 4G and at-home wifi access. Typically, it was only one or the other. Critical Analysis/Moving Forward Perhaps the most interesting idea that we gathered from our time at the teen center was the fact that most of the kids didn’t seem to use internet for what would be deemed valuable things. It was often unclear whether their wifi access was limited because of poor connectivity or because their parents tried to limit their video game/ TV/ and youtube usage. Nearly every child we talked to, regardless of their connectivity, had a nintendo switch, a PS4, or some other gaming device. It’s interesting to think about the moral implications of providing free or lower-cost wifi to children that don’t necessarily use it for educational purposes. A quick walk through the teen center showed most children playing Fortnite or Call of Duty on the TVs or playing some sort of game on their phone. While our project is incredibly important in so many regards, it’s also important to think about the drawbacks that can come with unlimited internet access. On a more positive note, we are hoping to finish up our data collection and begin analysis in the coming week. Christina is going to scan and email the paper results of the surveys that we distributed in the Spanish speaking Ambassadors meeting last week. They had agreed to try to distribute the surveys to their community members and friends. We will also aggregate the new data that we received from the teen center and hopefully begin to analyze all of it in R or Stata. Over the break, we’re also hoping to make some progress on our final deliverables. Kendall is going to work on creating an infographic and heat map, Kelli is going to work on qualitative analysis, and Neil and Katherine are going to begin work on the presentation. |
Archives
November 2020
Categories
All
|
 RSS Feed
