|
I. Project Updates
Last Monday and Wednesday, our group commuted to Oakland to assist our community partners in their outreach meetings and meet more of the Resilient Oakland Team. At the Monday community meeting given in English, Gideon and Ryan acted as scribes and participants, brainstorming possible ways to engage under-represented groups as well as design fair retrofitting policies. The community meeting on Monday was attended by 8 community members, all of whom were home owners, and one very vocal man who was a landlord of 60+ units around the city. In speaking with Victoria after the meeting, it became clear that one of the main takeaways was that there might be groups within Oakland that the city has not taken into account yet when designing their retrofit program – most notably, in the meeting, condominium communities. One woman was a member of a condominium, and she was vocal about the difficulties that could be faced when dealing with the prospect of a retrofit needing to be approved by a board. Unfortunately, the community meeting on Wednesday (Spanish) had no attendance. We started discussing reasons for that to be so, and thinking of possible strategies to reach and engage more people. For instance, by publicizing the program at schools and libraries so as to get to adults through their kids, who also happen to be more engaged in social media (another powerful option for outreach) than the average hispanic parent. On the bright side, during that visit to Oakland we had the opportunity to meet with Tim Low (Oakland’s building inspector), as well as Danielle Hutchings and Dana Brechwald from ABAG’s resilience program, at the City of Oakland. Over the course of this week we set up an Oakland Resilience email account and begin subscribing to Yahoo Groups representing various community groups in the City of Oakland. Some groups were for neighborhoods within the city and some were for interest groups; they ranged from 20-800+ members. We estimate that the Resilience team will be able to reach out to around 3000 people through these various groups. While no outreach has been done yet, Sue believed this was an important step in developing connections to pre-existing networks of public stakeholders. In addition to setting up an updated Yahoo Accounts and joining the large number of community groups, we created a Facebook Page for the Oakland Retrofit program, creating one place for all the information that a tenant or landowner might need to retrofit, including links to the Oakland website. Sue Piper sent out the first rendition of the page on Friday, and we will be continuously updated the page with comments from the team. II. What We Observed and Learned The community meeting on Monday was attended by 8 community members, all of whom were home owners, and one very vocal man who was a landlord of 60+ units around the city. In speaking with Victoria after the meeting, it became clear that one of the main takeaways was that there might be groups within Oakland that the city has not taken into account yet when designing their retrofit program – most notably, in the meeting, condominium communities. One woman was a member of a condominium, and she was vocal about the difficulties that could be faced when dealing with the prospect of a retrofit needing to be approved by a board. Overall, the general attitude was amicable. The homeowners truly seemed there to learn and become more informed about the situation. It did not seem like they were using this meetings as simply a platform to air grievances held against the city (although there was one man who was rather bluntly expressing his dislike of rent-control). The only time attitudes shifted into anger was when a slide was shown detailing the proposed aims of a city-wide retrofit program. People became irate at the notion that “severe structural damage” was apparently a satisfactory outcome, in the eyes of the city, for some structures in the event of an earthquake. The city’s rationale was that some structures were in such a sorry condition that anything short of complete collapse in the event of an earthquake would be acceptable. Both Ryan and Gideon agreed that that particular slide should have been defined further or removed, as it brought to focus the lack of set retrofit standards and resulted in confusion and anger. Although our meeting with ABAG and structural engineers Tim, Danielle and Dana on Wednesday was very productive, it also left us with some uncertainty about how our efforts could contribute to the program. Particularly, we learned that ABAG has already worked on some mapping initiatives including census data and seismic shaking, which was part of what we stated as our goal. As Oakland is so close to the Hayward fault, Tim described, the shaking intensity is high and does not vary much throughout the city, thus, making it nearly not useful for prioritization efforts since it would assign virtually the same vulnerability to all locations. Regarding socio-economic data, there was also a limitation due to the fact such information must not be disclosed at the level of households, whereas aggregated measures (such as those from the census) are not specific enough. We hope that some results from the survey being conducted by the City are available soon so that we can gather some information at the level of blocks or buildings. Finally, we realized that the problems ABAG and the City are most concerned about are beyond the scope of our project, namely: an analysis of the cost and associated risk reduction of retrofit strategies at the city level is clearly the most interesting result we could have, but as much as we’d like to work on it, it certainly exceeds our timeline and training. During the meeting we also gathered some data about soft-story buildings (collected from owners) which includes information about materials, open spaces, number of stories and other layout information. With a preliminary analysis we found that 3-story buildings constitute the median, average and mode of soft-story buildings in Oakland, so we might narrow our analysis to that specific archetype. We also will perform additional analysis on this database to detect any other patterns that might be of interest to our partner and communities. III. Critical Analysis & Next Steps Based on our community outreach we have identified some key challenges that face the Oakland Retrofit team. In outreach efforts, it is apparent from the low attendance rates that the Oakland team has not yet been successful at engaging the tenants and landowners of the 22,000 soft story homes; this could be for several reasons, described by a few of the participants in the outreach sessions. One such reason is the notion that there is a mismatch between the risk that the tenants perceive and the risk that the city has discerned through studies. Although the city understands the risks, perhaps these risks are not being communicated effectively to the community members. Owners, on the other hand, we found to be relatively more motivated to commit to the financial costs of retrofitting, and saw retrofits as a means to protect their assets. Another general reason for low attendance could be technical and logistical. There were a few broken links on the city website, making the page with the community meeting times and locations inaccessible. Notice of these meetings, such as the one on Wednesday, was given on relatively short notice, a week before the fact. On the technical assessment side, Camilo and Luis discussed with ABAG and the structural engineers our idea of mapping the relative vulnerability in terms of earthquake measures. As Tim, the structural engineer detailed, a map of vulnerability in terms of earthquake shaking would not necessarily be useful to them, because Oakland’s close proximity to the Hayward fault the whole area essentially at risk, and individual differences in regions would not be consequential. Moving forward, we would like to shift our focus from providing new information and analysis to communicating the specific risks of earthquake damage to community members with GIS maps and diagrams of the structural damage. This is feasible, given that the variability of the soft-story homes is low: most soft-story homes are 3-story and follow a very similar layout. With the assistance of Tim, the structural engineer for the project, we hope to deliver an informational pamphlet that will engage tenants and hopefully motivate retrofitting. To achieve this, we hope to classify the soft-story buildings not by earthquake risk but by categorizing structural type, based on factors such as the ratio of concrete to open space on the ground floor and the number of stories. This pamphlet, as we envision it now, will include a pictorial, schematic model of the most probable damage that will occur to each of the three structural categories, and list out the potential damages as well as potentially list out costs of repair. With GIS, we might also be able to create a map of Oakland that links regions of soft story homes to their most common structural type. With this pamphlet, we envision that a landowner can identify where in Oakland they reside, and use the related picture to identify specifically what a most probable earthquake might do to the structure of their building. We will vet this idea with our community partners through the following weeks and shape the idea with input from the Resilient Oakland team. Update on Project Activities
This week, we had a conference call with our two partners to finalize our survey instrument. We also are in the works of having our survey translated into Spanish which will be completed by this weekend. In order to gain a better assessment on which method (in person survey, online form, paper copy) the survey is best conducted, we each went out to run some tests. This week we also confirmed our target population and have been working with Friends of Caltrain and Working Partnerships on securing organizations that would be willing to help us. So far we have the following organizations lined up to distribute surveys on our behalf next week: Services, Immigrant Rights & Education Network (SIREN), Watercourse Way, Philz Coffee (Middlefield/Facebook and Forest Sites). We also have a verbal agreement from the on-campus student organization Habla that they will help distribute our survey to their class. Here are details about the organizations that are willing to assist us and the links to their website where we found their mission statements and information: Services, Immigrant Rights & Education Network (SIREN) has a mission to empower low-income immigrants and refugees in Santa Clara County through community education and organizing, leadership development, policy advocacy and naturalization services. They believe that all people regardless of legal status or nationality are entitled to essential services, human dignity, basic rights and protections, and access to full participation in society. Link: http://www.siren-bayarea.org/about/ Watercourse Way is a Bath House Spa that opened in Palo Alto, CA in 1980. Link: http://watercourseway.com/about-watercourse-way/ Philz Coffee is a coffee company that has store locations across the nation. Philz prides itself on bettering people’s days whether that be through their amazing cups of coffee or great customer service. Link: http://www.philzcoffee.com/Our-Company Habla is a Stanford student-run organization whose mission is to empower adult workers on campus through English-language literacy and conversational skills. Under the guidance of English teacher Sara Tevis, the program is founded on one-on-one tutoring sessions between students and workers. In addition to tutoring, Habla seeks to connect the student and the janitorial communities at Stanford. Link: https://hablaconstanford.wordpress.com/about/ What We Observed and Learned During testing we learned a lot. The major thing that stuck out to use was the great need for a survey written in Spanish. At the time of testing, our Spanish survey was not completed so we had to make do with only the English version. Although the survey takers were able to complete the survey, they mentioned that a Spanish survey would have sped up the process and would have been easier to understand. Another thing we noted that we did not expect was that the survey took longer than we expected. One of our team members also expressed how they were a little uncomfortable just standing there waiting for the respondent to finish the survey. This could have put pressure on the respondent to speed through the survey and not really answer the questions fully. We learned that survey distributing is no joke. It takes a lot of back end work to really fine tune the questions to be as unbiased and concise as possible. Then making sure the participant is comfortable and understands the questions is another hurdle. We are currently identifying ways to overcome these obstacles and make the survey collection easier and comfortable for both parties. Critical Analysis/Moving Forward Some of the ways we plan on easing the survey gathering process are currently underway. We will soon have a finalized Spanish survey set up and will also create a Spanish online survey. We are also going to try and avoid the one on one paper survey method as it creates an invisible wall between the survey taker and the conductor. Instead, we will try and do all of our one on one surveys through verbal communication. We will read out the questions and mark them as we go along. We will however, not ask the demographic questions out loud and instead hand over the survey instrument to them so that they can fill it out anonymously. In larger group settings, like when we conduct the survey through Habla or SIREN, it makes sense that all respondents take the survey at the same time and proctors just stand to the side. It is important that we note that all responses are confidential and will only be used to help determine a fare integration need. Moving forward, we hope to get responses from 200 individuals who work and live around the Santa Clara District. While a lot of the surveys will be conducted through partnering organizations, we will still be collecting surveys on the ground. We will go around Stanford’s campus asking custodians, kitchen staff, and gardeners if they can spare a few minutes to help us gather data. Additionally, we will be going out to different transit stations to survey individual riders. Adina and Charise are determining which stations would be our best bet at getting a representative sample and will let us know on our next meeting. Our next meeting is scheduled for Tuesday, February 17th at Working Partnerships in San Jose. There we will discuss our initial test survey findings and coordinate survey distribution amongst our partnering organizations. Next week, we hope to get 100 surveys completed and make it out to different transit stations to survey. We will also start our website design and begin drafting our literature review for the final report. We have been chipping away at our three deliverables and here are updates:
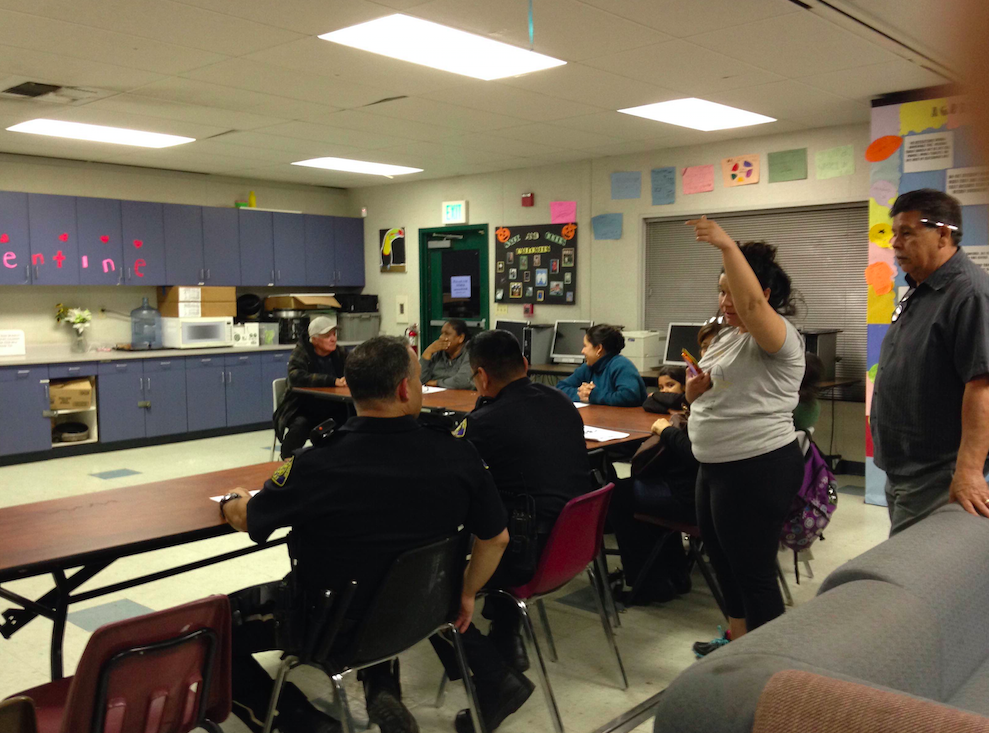
1) Survey: We have written a survey and translated it into Vietnamese, Spanish, and Chinese. English version: https://docs.google.com/a/stanford.edu/document/d/1IbC5t4OxPKrEpYfKqVUmC3LlPzm4fSD2vxc4iZ9KjBU/edit Vietnamese version: https://docs.google.com/a/stanford.edu/document/d/1IbC5t4OxPKrEpYfKqVUmC3LlPzm4fSD2vxc4iZ9KjBU/edit Spanish version: https://docs.google.com/a/stanford.edu/document/d/1C5qN4-tA_dGoHpXs1iYFa1-nnSmpmnz_VL9BFtGK4y4/edit Chinese version: https://docs.google.com/a/stanford.edu/document/d/1KTzst-v0KNZ7K3YAHSk9oH0aHLJOfQTlE5doAOf72gw/edit After exhausting the color printer in Green Library, on Wednesday, we carried our stack of surveys and fliers to San Jose. First stop: The Flea Market Unfortunately, the attendance rate on a Wednesday was close to zero. We have a hard time finding participants. A pair of mother and child, however, were very invested in the survey and spent ten minutes asking us questions about hazardous waste. Eventually, a vendor approached us and said that we had to register at the information booth. Walking around soliciting surveyors was not permitted. Lesson 1: Flea markets on a weekday and soliciting survey participants are a big no-no. Next Stop: Downtown San Jose We stopped by the San Jose Technology Innovation Museum and explored the area for some possible project exhibitions. Unfortunately, we were not able to schedule an in-person meeting with our contact Michelle but we hope to arrange a phone conversation in the coming week. San Jose Public Library: The crowd rushing in and out of Tully Cafe annexed to San Jose Dr. Martin Luther King Jr. Library gave us a great pool of people to survey. We had university students and professors from San Jose State University, city employees, Girl Scout parents and their children, and other downtown visitors. McKinley Neighborhood Meeting: We had a great turnout at the community meeting. It was a change of environment surveying in a close-knit community setting where everyone was seated around a table and knew each other. As opposed to the surveying at the San Jose Public Library, it was easy to gage what the main concerns of the community was from the meeting and understand where household hazardous waste fit in their lives. One of the main concerns that night was the homeless population in San Jose. The police who came spoke about the Jungle, a homeless encampment that was cleared away recently. He said that because these 300 people are now without a place to settle, most of his job involves clearing away new homeless hotspots before they grow as big as the Jungle was. The problem is once he clears one, another pops up. It was humbling to see our cause in the perspective of a community agenda. That is not to say that household hazardous waste is not important, but rather, taking about homelessness or security is a more relevant topic for many residents. It is something they see and witness every day. Whereas the hefty jargon that comes with household hazardous waste can be intimidating. We need to find a way to make household hazardous waste feel as relatable as these other pertinent issues. The fact is everyone has them. People who we surveyed told that they just keep it lying in their house. Many put their motor oil, paint, and other hazardous products stored away in the garage. It exists but it can be kept out of sight and out of mind, until it comes time to move out of the house. To help us put household hazardous cause into the political perspective, we spoke with San Jose City Council Member Raul Peralez who offered to drive us to the Caltrain station. He told us that the first thing on his agenda right now is pension reform. There are unresolved litigation that carried over into his term of office. Before he proceeds to other pertinent issues, he first needs to finalize the details on pension reform. Then, he would like to focus on affordable housing. Mr. Peralez said that Santa Clara recently closed down its only homeless shelter, sending an influx of homeless people to San Jose's already overfilling homeless shelters. While this can be perceived as problem, the influx is also a social implication. Compared to many cities in the Bay Area, San Jose is more welcoming to persons of low or modest income. They are accommodated in San Jose. Thus, Mr. Peralez wants to implement for housing to further this welcoming spirit. We were again humbled by our conversation with Mr. Peralez. If there was any takeaway from that day, it was the humbling feeling of presenting our work, the survey that was created in an academia bubble, to the forces of the real world where it took a lot of effort to draw people attention to a topic that is often dismissed amidst other worthy causes. We are not discouraged. In fact, as we hear about all the other ongoing political, social, economic happenings, we know that reaching out about hazardous waste is important. If people are continuing to come to San Jose, we need to make sure they can have a safe living environment devoid of illegal hazardous waste disposal. Future Outreach Events: February 22nd: San Jose Household Hazardous Waste Information Booth at Vietnamese Tet Festival Celebration February 28th: San Jose Household Hazardous Waste Booth at Earthquakes vs. Galaxy Game 2) Tech Museum and Green Schools Collaboration: We are in the midst of jumpstarting this project: finding appropriate contacts, setting up phone calls, sharing our vision, etc. The idea is to create a collaboration between schools and the tech museum for a household hazardous waste workshop. Our main contact from the Tech Museum is Michelle and we look forward to speaking with her in the coming week. 3) GIS Map: We are compiling our Excel database sheet. We hope to finish by next week so we can start working on the template. https://docs.google.com/a/stanford.edu/spreadsheets/d/1Lw8pK8vLEGGFNibtrPk20rSIO7qv2dlL8sgPklCVp-Q/edit?usp=drive_web Surveys, Branding, and Mapping, Oh My! Branding One component of our project that allows us to really explore our creativity, and has allowed Mia and Katie to utilize their graphic design skills is the branding kit that we are developing. The kit will eventually include a variety of elements--a logo, a mission statement, color and font specifications, a brochure, and perhaps even a short video on the project--but so far we’ve been mainly brainstorming and discussing the characteristics that we want our branding materials have, and the message that we want them to convey. So far, most of our efforts have come from drafting the logo. When the logo is finished, it will essentially be the face of this initiative, and will be representative of the work we are trying to accomplish, so it is important to us that a lot of thought and consideration go into its development. We decided a bit earlier on, with Janice’s help, to title our initiative “Women Bike SF” so Mia’s goal this past week was to toy around with the symbols and layouts that can be used to transform these three words into a memorable and aesthetically pleasing logo. Mia wanted to incorporate a bicycle wheel or two into the logo, but also wanted to include something that would express femininity or somehow promote women’s empowerment. Initially, she also wanted to include something symbolic of SF--such as the Golden Gate bridge or a cityscape. 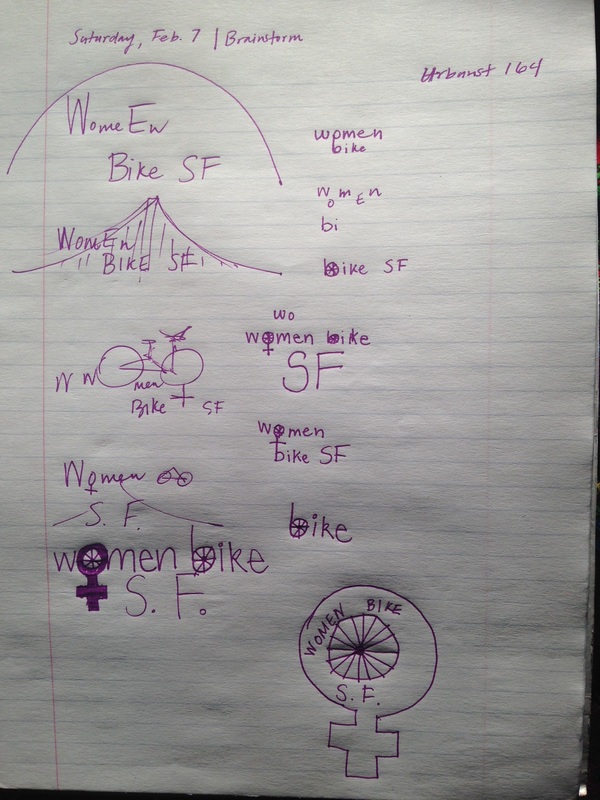
Eventually, Mia came up with the idea to merge the symbol of the bike wheel with the symbol for Venus, which is commonly associated with the female sex, and with feminism. With our brand’s main symbol in place, she then brainstormed how to include the “Women Bike SF” phrase in, or next to the symbol, and ended up placing it just beside it in block letters so that the significance and size of the symbol was maintained. Mia then experimented with different color schemes, and came up with the following prototypes: Next steps will include reaching final conclusions on the logo’s color scheme--perhaps via informal surveys and a vote taken at the focus groups we will conduct next week, and then moving on to the other branding components mentioned above. Deland, what do you think?
SFBC Survey/Mapping On February 10th, our first survey was sent out through the SFBC's weekly e-newsletter. This survey was only sent to SFBC members with the aim of collecting information about specific commutes, demographics, their opinions on why women are/are not biking, and what actions we can take to encourage more women to bike. The survey was received with immense interest. Within 24 hours we have received over 200 responses! We are excited to start combing through the data and using the responses to direct our project efforts. Specifically using the commute routes, we are planning to create a GIS map to identify popular routes, and key neighborhoods that have a substantial amount of female ridership as well as limited ridership in order to propose areas in which the SFBC could direct their efforts. Unfortunately, the survey responses do not include turn by turn directions for each route, only a start and end point. For the GIS map, we may refer to popular bike routes given the start and end points or we will have a more direct way of obtaining these routes during the focus groups, possibly the old fashioned way using paper maps and highlighter, and I will translate that to electronic form for the final map. Outreach Originally, our plan was to contact a bunch of different organizations in order to get information about women that don’t ride bike in San Francisco. Realizing that this was a very time consuming task we decided to contact The Women’s Building in San Francisco. The Women’s Building’s executive director, Teresa Mejia, was really interested in the project and agreed to help us. Since The Women’s Building is not allowed to send emails about anything other than their events, Ms.Mejia agreed to send out the survey to their 9 community partners. Since some of the community partners are primarily Spanish speakers we had to translate our surveys to Spanish. Even though Ana Sophia took care of this (since she is the only Spanish speaker) we realized how difficult is can be to translate some of the technical words we included in our survey. Another issue we encountered is thinking about what would be the best way to send our survey in order to reach out to the largest number of women. What we decided is that we will first try the online approach and send out the email on a google forms format. If we don’t get enough responses in that format we can try to make a trip to the Women’s Building and do in person surveys. We can coordinate this trip with the focus groups we will be holding on the 21st of February. Update on Project Activities
This week was our first full week in data-collection mode. We have all started making calls and are beginning to better understand the challenges that we’ll be facing. We had a predictably low yield rate, with 4 interviews for the 20 calls conducted. We came into contact with some preliminary challenges, like phone numbers that are no longer in service and clients that felt uncomfortable speaking to us. The data that we collected helped get our creative juices flowing with regards to our end product. We consulted with David in the GIS lab about possible options for visualization on our project and he advised us on a few options. The first is to visualize the data in terms of cities; we would aggregate the data by place and show movement by showing change in population of one city and growth in another. The second option is to visualize the data as individual data points. The visualization on this option would be to make a distributive flow map [e.g. http://www.gislounge.com/wp-content/uploads/2014/04/network-flow-map.png] which is similar to what our original vision for the project would be. We also welcomed another member to our team this week; the CLS-EPA intern, Ashley. Ashley will be taking on some of our calls moving forward, and thankfully, will lighten Toni’s Spanish call load! We need to make sure to clarify with Jason & Ashley how involved she wants to be in our project. Deland suggested that we invite her to our final presentations, which we all think is a great idea. What We Observed/Learned Another task for this week was to begin engaging more with the existing community involved with mapping eviction on a broader scale. In thinking about the end products that we wish to create, we thought the natural first step would be to consult other projects such as the Anti-Eviction Mapping Projects (http://antievictionmap.squarespace.com/) and previous projects completed through this course. Our group was in awe at the depth of information and evidence of effort put in to projects such as the ones above. There is seemingly no way to make sure that our deliverables make an impact if our audiences don’t take the time to look at them and the more aesthetically pleasing the graphic, the more time we spent engrossed in it. This thus validates our need to make careful decisions in constructing our maps. In the beginning stages of data collection, we are already starting to prioritize which data is going to be the most important and impactful to showcase in our interactive maps. The trend that we are finding to be most pertinent so far is with rent comparisons. The clients that we have surveyed have indicated that after their eviction, they were forced into living situations with the same rent or higher. The unsustainability of high rent prices is problematic because the client could potentially face another eviction. We have also found that the majority of people are moving to places without rent control, where they could be subjected to substantial increases in rent without warning. Critical Analysis One surprising trend that we are finding is that people are not necessarily moving to different cities or far away from their previous residence. This could just be unique to the sample of people that we have contacted thus far, however, if it is a clear trend throughout the rest of the data, the implications and intent of our project could change drastically. If the movement of people as a result of evictions is not of particular interest, this project’s central question may not be “where are these people moving after their eviction?” but rather “are these people experiencing multiple evictions as a result of staying the in the same areas?” Our choice in visualization will ultimately come down to what the data looks like. If the data shows that people are moving into the Central Valley and out of the bay, it would be feasible to do it by city over time. However, if there is mostly just movement between the main cities, then it might conflate the data by showing no change. If that’s the case, the flow map would be a good option. The experiences from this week are teaching us to try to leave our biases out of the data. At the beginning of this project, we were so sure that we would see certain trends or get back certain types of information, but as we get further along, we realize that our expectations were a little off the mark. This, however, does not deem the received data as less valuable, but forces us to keep asking questions about why we are seeing certain trends and reevaluate the purpose and ideas of this project. |
Archives
November 2020
Categories
All
|

 RSS Feed
