|
Update on Project Activities
This week, our team explored the Menlo Park Green Challenge website in further detail and held a conference call with Diane Bailey in order to provide updates on our project progress. During our call, we offered suggestions to improve the accessibility of the site, discussed potential strategies for surveying students and their preference of prizes for completed actions, and set a date next week to meet on-site. We also met outside of class to begin our scope of work and get to know each other better! What We Observed and Learned In order to organize all of our suggestions for the Green Challenge site, we held a meeting before the call and grouped both our older and recent observations into specific topics. When addressing Diane, we went over each of our suggestions in detail, all geared towards making the site less complicated for the average household. We first shared our suggestions from last week: to make the site user friendly by adding time commitment and cost filters on the actions as well as using survey results to determine the most applicable actions to get started on the Challenge. We also think a beneficial addition to the survey would be a checklist of all the actions, giving users the option to check off completed actions before being taken to the main page with all of the actions. This way they don’t have to search for each completed action individually, and can get to new actions more quickly. Next, we explained our most recent concerns surrounding the content of the actions and the point system. Regarding the general actions, ranging from recycling to installing an electric pump heater, the descriptions on their respective pages are extremely long, and sometimes lack specificity and/or citations for important statistics For example, the article discussing solar panel installation uses statistics matching the size of a solar system in comparison to the size of a home, but loses credibility by not citing the source. Furthermore, how the points were assigned to each action was confusing and somewhat arbitrary. To provide context, an “easy” action like line-drying clothes has a very similar point value to the “challenging” action of insulating one’s floors and walls. Each of our suggestions centered around making the Green Challenge more feasible, easier to understand and more relatable to participants. In order to incentivize students to participate in the Green Challenge, we need to find out what types of prizes they would be most interested in. We are going to email the principals at La Entrada and Menlo Atherton to see if we can send a survey home in students’ take-home folders. During our meeting this week, we got to know each other better, we outlined our project scope of work, assigned team roles, and organized our time table for completing the deliverables due in the following weeks to the class and our community partner. Critical Analysis/Moving Forward Diane appreciated our suggestions for improving the Green Challenge website and urged us to compile these notes into a document so she could share our findings with the Menlo Spark team. This action will be a part of our scope of work so that we can make a timeline that fits in with each of our goals well. Next week we hope to provide more website suggestions, and include them in our write up, decide the most mindful and ethical way to survey teachers and students, send out our survey to school students and/or teachers, and get more connected with the community we want to serve. In addition, we hope to find a family and/or students to interview within the next few weeks so we can publish a more realistic success story on the Green Challenge website. In order to do so we will write up some information about the story so that it can be advertised to families via Menlo Spark’s newsletter. Assessing Future Housing and Transportation Patterns in the City of Palo Alto | Week 3 Reflection10/13/2017
Current Activities
Our group has completed an intensive literature review of the papers provided by Friends of Caltrain and Palo Alto Forward. This included six blogs, eight reports, and two book references. The following section summarizes the relevant findings. All articles concerned housing issues, but varied between policy trends and housing preference surveys. In the survey articles, researchers found that more individuals want a larger house, and more walkable community. Unfortunately, the two preferences are often exclusive, with larger houses leading to sprawled, expensive, suburban neighborhoods, and walkability leading to higher housing densities. However, people of all ages generally preferred walkability over house size. They would be willing to live in smaller units, if the surrounding community resources were ideal. The articles found that people are more willing to walk in areas with lower vehicle activity, and more public transportation. This is the result of the cultural shift from the culture of the late 1900’s, which favored automotive-based suburban development, to that of the millennials and from the increase desire for the retiring adults of the Baby Boomers generation to move into smaller houses (Benfield). The housing shortage situation may improve over time as cities reevaluate their zoning plans and design neighborhoods with larger populations densities in mind. Regarding the policy articles, researchers suggested changes to CEQA, LEED, and other major zoning influencers to allow for improvements in existing infrastructure, and more multiunit housing projects. The Foot Traffic Ahead Report found that categorizing cities as suburban or urban is an outdated methodology. A city is comprised of walkable urban or drivable suburban regions. The report analyzed the top 30 urban cities in the US, and found that higher education and housing prices are significantly correlated to city walkability. The creation of these “regionally significant walkable urban places” (Leinberger 8) are essential to improving the quality of life and housing in Palo Alto; one major observation that particularly fit Palo Alto was that technology-based companies, for which the city is known for, are often the driving force of such development as these companies thrive off of the innovative and collaborative environment that walkable urban development creates (Leinberger). However, to ensure that this development results in dense walkable housing with a high quality of life, Palo Alto’s City Comprehensive Plan has shown the importance of improving pedestrian infrastructure, including bike lanes and the use of trees to create separation between roads and pedestrian sidewalks (United) Approximately 80% of homeowners in Palo Alto make more than $125,000 a year, and 80% of households are single family residential. The city is housed for the wealthy, but employs thousands of people from all income categories. Based on 2012 RHNA reports, the amount of multiunit complexes or low income housing being built in Palo Alto is far too low to accommodate population growth. A growth mind you, that has slowed from one of the largest in the state (13% in 2005) to one of the smallest (3%) due to low housing available and age splitting (mostly elderly or young individuals that do not breed live in Palo Alto, with 68% of households having neither in each category) (Richardson). California’s housing market has not recovered from the 2008 crisis. As a result, new housing permits are far lower than the growing population. Pre-2008 housing was projecting over 200,000 houses a year- in California, but has dropped to 100,000 as of 2015. After the literature review, all four of us met with Elaine and Adina after class to discuss survey questions. We mostly discussed upcoming work (found below), but also discussed our grasp of the readings. Elaine put us in contact with Tiffany Griego, the Planner for Stanford Research Park, important for its large role in employing many of Palo Alto’s workers. Since this area is a focus of our project, we will contact her for past survey data in the area, as well as use her input to design our survey questions. Based on the readings, our questions should concern housing, transportation, and community design. Upcoming Work We are preparing our survey questions for Palo Alto’s Planning Director by October 18th. This includes surveys of different lengths, as well as online versus paper versions. In preparation for the midterm presentation, our group will have to quickly summarize and add Gitelman’s comments to the slideshow and Scope paper. We will likely incorporate questions used in the articles we read; modifying them to be relevant to Palo Alto’s housing and transportation settings. The goal is to ask specific questions targeted towards individuals who commute in and out of the City of Palo Alto as well as individuals living within the city. We want to figure out what our interviewees think would be beneficial to their daily commute to and from work. We will conduct sample surveys the weekend of the 21st to evaluate the clarity in our questions. Members of our group have identified representatives from different walks of life, and will give them the sample survey to collect criticism. Based on the feedback, we will finalize our survey and run in-person trials the 28th and 29th of October. As of now, we will survey three sites in person; CalTrain Station, Farmers’ Market, and University Avenue. We feel these three sites represent a diverse samples size, with the first specifically catering to those dependent on transit, but are willing to explore other options if our data collection is limited. Elaine has generously provided a popup park tool kit to make us seen approachable in public. Predicted Issues Adding the excess criticism given by the Planning Director on the day of the midterm will likely be a challenge, as we have exactly 30 minutes from when the meeting ends, to when class starts. At least two of the four of us will be modifying the PowerPoint while we are in the meeting to maximize available time. Another issue is sample bias. Specifically, we are collecting site data on Halloween Weekend. This may lead to a spike in single family homeowners (with their kids) that are quite happy with their current living situation. We are hoping the large influx of commuters through the CalTrain Station will give us an equivalent concentration of non-local housing preferences. Update on Project Activities
This past Sunday, our team had brunch with Alex Andrade in order to create an objective and logistical timeline for the next few weeks. During our discussion, we decided to dedicate the next two weeks to conduct site visits to Mountain View’s Castro Street (downtown) to interview local business owners and their employees about the pending preparations for the enactment of the $15.00 minimum wage ordinance. To do so, we are dividing our outreach to a physical and a digital medium. Physically, we are splitting up into two teams (Gabi and Sean; Holden and Denzel) to visit Alex this Thursday (10/12) and Friday (10/13) in Mountain View where he works at City Hall to discover the scene on Castro Street. We have created two separate lists of questions for employers and employees to discover more of the economic (employers) and social (employees) impacts and influences of the ordinance onto the more than 260 local businesses in Mountain View. Digitally, we will be outreaching to the same businesses (with the help and relations Alex already has) with an anonymous Google Form that has the same questions, as we assume that individuals will be more hesitant in-person and could contribute more freely online behind a screen. What We Observed and Learned During the first site visit on Thursday, we visited the Executive Directors of the Central Business Association (CBA). During our initial meeting before outreaching to businesses, we discussed the questions we prepared. We decided to modify the wordings of our questions to more base-level, “easy to comprehend with little time” questions because of our limited time to conduct field research. After visiting 5-6 different businesses and their owners, we discovered a multitude of opinions that confirmed Alex’s assumptions about their reactions to the minimum wage ordinance. For one, many businesses have a negative opinion of the timeline of the wage increases because they cannot compensate for rising commercial rental prices, sustaining the same number of work-hours for their employees while balancing their (the owner’s) hours at the same level, and finally, they do not have enough time to prepare financially for the wage increases. Most businesses highlighted that although Mountain View will be economically growing at an unprecedented rate, the minimum wage is not at the same level as the “living wage,” which many owners stated is around $30-35 per hour. Furthermore, although we attempted to allocate ten or so minutes to each business, the owners were more than willing to chat about the ordinance, with some interviews lasting more than 25 minutes. In the future, we will be more conscious about allocating our time more efficiently. We will comment further on our Friday visit on the reflection due for next week. Critical Analysis/Moving Forward After interviewing businesses in downtown Mountain View, a few key themes and actions were prevalent throughout their opinions:
Update on Project Activities
During our first meeting with NEN, our team was also introduced to Luis, a graduate student with the Stanford Urban Resilience Initiative (SURI). Our team is currently in communication with Luis, and we hope to get together with him in the coming weeks so that we can learn more about the projects SURI has worked on. While exploring the SURI website we found that they had worked on a project regarding the 2011 Christchurch earthquake in New Zealand. The Christchurch earthquake is one of the natural disaster events that our team is currently researching to better understand the variety of issues that a community faces after a catastrophic incident. In our research, we found an interview featuring John Hamilton, Christchurch’s Director of Civil Defense Emergency, where he talks about some of the lessons he learned from working with the Christchurch community in the aftermath of the seismic event. Multiple times in the interview, Hamilton states how important preparedness is in order to become a resilient city. Though Christchurch was prepared in many ways, Hamilton points out that one of the things that they were not prepared for was regarding post-event communication with community organizations. He learned that many local organizations were eager to help in various ways after the earthquake but were limited in how much they could help because they did not have enough tools and resources to utilize. This lesson really emphasized to us the importance of community engagement and how events such as the Resilient Bayview Neighborfest which was held this past weekend helps foster the relationship between communities and their local resource partners. We hope to continue finding lessons such as this one as we do further research on past and current disaster events. What We Observed and Learned This last week involved a review of documentation surrounding different meetings related to NEN and the Strong Homes project. What has been apparent is the high degree of complexity of NEN’s different networks in bringing together different sectors and working with different communities. In Bayview, for example, we reviewed a report of a community-oriented vulnerability assessment which detailed the process of different working groups being formed to work under a broader steering committee. In developing these the question comes up at the longevity of these working connections and how they could be linked to broader community organizing. Our team also reviewed several videos surrounding a meeting in city hall to discuss NEN, with several keynote speakers from public, nonprofit, and private sectors prefacing a community empowerment activity. Probably most poignant was LaToya Cantrell’s interview on her work on the ground following hurricane Katrina, A New Orleans councilwoman, Cantrell emphasized the importance of acknowledging and utilizing existing social capital in each community. Her main points included that our cities (New Orleans and San Francisco) are already resilient, and that people are their own first responders. Her key lesson from her community work post-Katrina is the need for a mapping of each community’s social capital - that is - who lives where, what assets and vulnerabilities exist. Accounting for the people in the community in a formal way will only allow for more empowered resilience with the resources and capabilities communities already have. Critical Analysis/Moving Forward Following a review of last week’s reflection, we realized there were some inconsistencies between our understanding of the NEN and its actual purpose. As mentioned previously, the NEN is a relatively complex organization with multiple facets to its services and projects. Leading up to the charrette, our team will participate in a webinar in order to gain a deeper grasp of the ways these NEN programs work to empower neighborhoods. We believe we can incorporate this knowledge into our thinking process when tackling the design of the disaster toolkit following the charrette. As outlined in the Haas Center’s Principles of Ethical and Effective Service, we want to recognize our community partners’ role as educators while making our work relevant to the community. By gaining a better understanding of the Neighborhood Empowerment Network, we will be able to make our toolkit design more relevant to their mission. Apart from the toolkit, we are also responsible for creating a 15-minute presentation on the health impacts of severe lifeline interruption during times of stress. After getting feedback from Daniel following last week’s reflection, we plan to look at multiple scenarios of lifeline interruption from recent tragedies in order to create a holistic glimpse of the possible challenges San Francisco could face in a similar situation. Moving forward, we intend to create better lines of communication between our team and our NEN partners. While scheduling conflicts between all members of this project makes this somewhat admittedly difficult, we find it imperative to share accurate information regarding our projects and understanding of the Network’s mission. Assessing Future Housing and Transportation Patterns in the City of Palo Alto | Week 2 Reflection10/6/2017
Project Summary Our group will be conducting surveys around Palo Alto to better assess changes in local housing preferences. These preferences will be motivated by a variety of factors such as affordability, proximity to work or commercial centers, or family size. Historically, single family residential housing has dominated Palo Alto, but due to increasing housing prices and the growing job market, people may prefer higher density, cheaper housing. We will design and distribute a comprehensive survey asking locals about their current living situation, and any changes they would like to see in the future. From this data, we will create a report on the shifting housing preferences of locals, and what factors are driving these changes. The report will include several theoretical personas that are expressing similar housing or transportation problems as the surveyed locals. Based on our findings, we will suggest a course of action to alleviate the burden for each of these demographics. The results of our research project will influence the final content in the Palo Alto Comprehensive Plan Update. Project Planning We recently met with Adina Levin from Friends of Caltrain, and Elaine Uang from Palo Alto Forward to discuss the first steps in designing our survey. The four of us will come up with comprehensive survey questions, addressing housing and transportation preferences of locals. These questions should distinguish relevant demographics by income, current housing, transportation, race, ethnicity, and what changes these people would like to see in housing and city planning. To help us develop these questions, Adina and Elaine provided us with an intensive list of papers and articles on the current/predicted housing and transportation situation in the region. Our group will finish the literature review by next Wednesday and begin to discuss questions types, survey locations, and inherent biases. We understand that people are busy and are rarely going to go out of their way to fill out a survey. Therefore, we are designing multiple survey types across multiple mediums to maximize our collected data. We will collect data in person from densely populated regions in Palo Alto such as University Avenue and the local Farmers Markets. Since people are walking by in rapid succession, we should plan to have a short, quick to fill in survey with a handful of important questions. In contrast to a longer, more comprehensive survey that provides specific lifestyle information from each participant. We are also going to design and distribute surveys on social media. This may include Facebook, Google, or other websites where everyone in a certain radius can answer questions relating to their current lifestyle as well as any changes they’d like to see. However, we think an interactive component will likely result in more people being willing to answer questions. This can come in the form of question games, quizzes, and other player participating strategies to make the survey seem more worthwhile. We plan on meeting with Elaine and Adina this Monday to discuss survey questions. There is a short deadline to design the web and paper surveys, because we are meeting with Palo Alto’s Planning Director, Hillary Gitelman on October 18th. She will ultimately determine which of our questions are appropriate, and more importantly, which questions are missing. This is the day of our midterm presentation, and therefore, will require quick incorporation and summarization of the relevant criticisms received. Shortly after the meeting, we will be implementing our finalized surveys online and around Palo Alto to collect the data. Once we collect the survey data, we will analyze the results and begin to design the report and visuals. The visuals will likely concern geospatial housing and transportation changes people requested, as well as the personas mentioned above. The report will summarize our findings and suggest actions to Adina and Elaine for how to better modify the Palo Alto’s proposed housing plan over the next 13 years. Predicted Issues The experiment requires us to gather objective, coherent data on the current and future housing situation in Palo Alto. However, all surveys are inherently biased due to the questions chosen by the project managers (us). We will work with our correspondents, and other members of Palo Alto to develop encompassing, open ended, and revealing questions to provide what we feel, will be a comprehensive data set. Also, the sites themselves provide specific demographic interactions that may not reveal the full scope of Palo Alto citizen preferences. We will try to survey as many people as we can, from a variety of sites including; markets, busy intersections, email server lists, Stanford faculty and local alumni. The validity of our findings is highly dependent on our sample size. Background Information and Reading The City of Palo Alto has recently published a Comprehensive Plan Update, listing their future development projects through 2030. Cities are required by the State to summarize current and future issues (and solutions) in the following sectors: Land Use, Transportation, Housing, Natural Environment, and Safety. Palo Alto also included Community Service, Economics, and Governance sections beyond the requirements of the state. For this project, we are interested in the current and future housing patterns around the city. Currently, single family residences dominate the housing distribution in Palo Alto at around 61%. This is not to say Palo Alto isn’t well planned in other respects. Below is a map of the Palo Alto region, colored to show land use distribution. The two business districts (grey) are directly north and south of the main residential centers (yellow). Green spaces are equally spaced across the residential regions and there are plenty of recreational sites. The main commercial centers are built along El Camino Real in addition to the Stanford Shopping Center. The noticeable issue is the lack of affordable housing to accommodate the increasing work force. 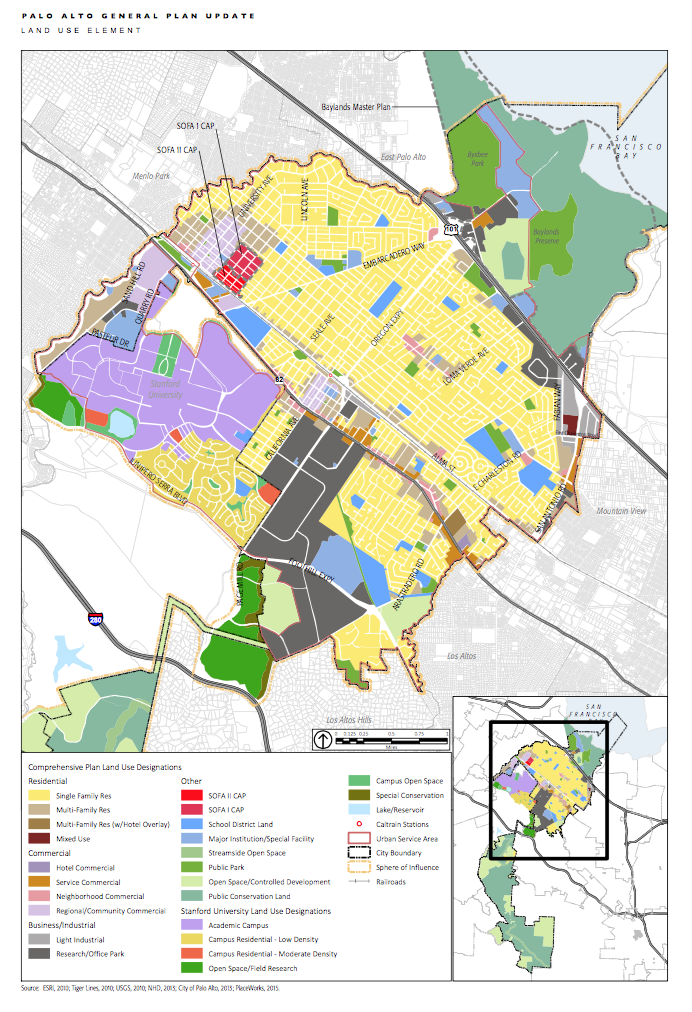 |
Archives
November 2020
Categories
All
|
 RSS Feed
