|
Update on Project Activities
We met with Alex Andrade Monday in order to plan our report on a minimum wage ordinance’s impacts on economic development (specifically in relation to low-wage workers in small businesses) in Mountain View. After giving a presentation to the entire class, Mr. Andrade sat down with our group to discuss the logistics for this quarter regarding our roles in researching the effects of the minimum wage increase. What We Observed and Learned To offer us some context as we begin our task, Mr. Andrade explained to us the prevalence of minimum wage workers in California. According to his data, approximately five service sector jobs exist for every tech job. Mr. Andrade also opened our eyes to the fact that about 20% of Google employees work for minimum wage. A survey conducted in Mountain View around 2015 found small business owners largely supported an increase in minimum wage, but recent reports worry Mr. Andrade about the potentially negative impacts of such a minimum wage increase on small businesses. He described one individual as tearful when she realized she might need to spend thousands of dollars more on labor each year. In addition to the above concerns, Mr. Andrade informed us about his expectations for an economic downturn in Mountain View within the next five years. He would like us to conduct updated surveys on the residents of Mountain View in order to determine what the city can do to retain residents as the projected downturn approaches. Regardless of our findings, we know the City of Mountain View’s minimum wage will reach $15.00 January 1, 2018. Mr. Andrade said he expects a 2% increase in each year afterward to account for rising costs of living. Our mission revolves around the discovery of future shortcomings that may require further changes to the minimum wage or other actions entirely. Some direct quotes (in bulleted form) from Mountain View’s website: Regarding employees:
Site Context Mountain View is an affluent city with a village feel. Local businesses fill in its downtown area. The city has a tech driven economy with Google being one of its major contributors. Its unemployment rate is 3%. Because of its attractive job opportunities Mountain View housing prices are inflated which makes it hard for those who work in Mountain View to live in or close to Mountain View. To combat this, Mountain View’s council decided to increase its minimum wage ordinance with the intent to give individuals more economic mobility. Critical Analysis/Moving Forward Mr. Andrade elaborated on what he expects from us in our final project deliverables. First, he advised we draft two surveys (one with questions for business owners and one with questions for their employees) and communicate the results in the form of a bullet pointed document outlining the goals of the research. He also said we can use the council reports seen online as templates for our final paper deliverable: a research paper describing the impact of the minimum wage ordinance. Mr. Andrade described this paper as a “stakeholder outreach engagement plan.” He then told us that, while unnecessary for our project, we can freely attend Mountain View’s city hall meetings every first Tuesday of month at 8:00 a.m. In terms of action items for the next week, we will be meeting Mr. Andrade for brunch this upcoming Sunday at 12:00pm to discuss our thoughts and to schedule our first field meeting. Since Mr. Andrade is a Resident Fellow at Trancos, his accessibility for meetings is even easier because he is living on Stanford’s campus. Update on Project Activities
On Monday we met with Jonathan Moore, Associate Planner and our community partner from the City of Salinas. We discussed some of the cultural and historical influences in Alisal that contribute to the economic and housing disparities residents face today. Since none of us are from Salinas or have visited the city before, we are mostly unfamiliar with the city, its infrastructure, its districting, its land use, and its people. Jonathan showed us a map and explained to us where Alisal is within the city and where agricultural fields are, which are actually not surrounding the Alisal area even though many Alisal residents work there. He also gave us insight on existing land use in Alisal. Most of the land is used for residences, which are mainly single-family units. One of the prevalent issues is that although these residences are meant for single families, the reality is that multiple families or extensions of nuclear families occupy single-family homes out of necessity due to financial and social circumstances. We discussed the issue of public housing options and private housing, which is usually operated by employers of migrant farm workers. In these private housing options, laborers are subjected to poor conditions such as overcrowding, no rent protection, and poor health and wellbeing. We want to look into the issues presented by various housing options and situations in Alisal to address the overall issue of affordable and accessible housing, and how transitioning from common housing types such as single-family units to multi-family units may relieve many of the issues Alisal residents face. We are also aware that development can be a major aggressor of displacement and gentrification in communities such as this one, so we want to discuss this issue with the Alisal advocacy groups and with residents to understand their needs and desires for their community and home. What We Learned: About Alisal The City of Salinas is commonly known as the capital of agriculture in the Central Valley of California. Our community partners refer to it as the “Salad Bowl of the World” as it’s the biggest producer of lettuce, artichokes, broccoli, and other major vegetable crops. Salinas has a rich history in California as not only a major site of agriculture and economy but as a site for migration, becoming home to immigrants from Mexico, the Philippines and Southeast Asia who sought jobs working as laborers in fields and farms. About the Project The Alisal Vibrancy Plan was created in response to advocacy from residents of Alisal, in the east side of Salinas, encouraging a “shift to more equitable investments” in the city. In 2014, the City of Salinas drafted an Economic Development Element (EDE) as a planning document for economic policies and conditions in the city, but for many residents of Alisal, the document did not sufficiently address economic disparities within Alisal. The project is in partnership with the City of Salinas, institutional stakeholders, Alisal advocacy groups, Working Groups and a Steering Committee. Our role as a team is to read the Alisal/East Salinas Housing Target Market Analysis (HTMA), and synthesize and translate this information to Spanish, and create an infographic that is easily understandable and accessible to the residents of Alisal. Critical Analysis/Moving Forward Community Partner Relations An interesting find from Monday, was that both of the liaisons for the partnership, Jonathan and his partner, did not speak Spanish. Being that over three-quarters of the population of the City of Salinas is Hispanic, we are interested in exploring how the dynamics will look like in terms of implementation and community input. Resident Participation We were told we would meet some of the residents during our first meeting which is a bit worrisome because they are the real experts on the issues facing Alisal. We may have to explore ways to ensure and perhaps encourage resident participation to ensure we are addressing their concerns and using their input. Questions to research and explore:
Next Steps Research
Meeting with Community Partners
Update on Project Activities
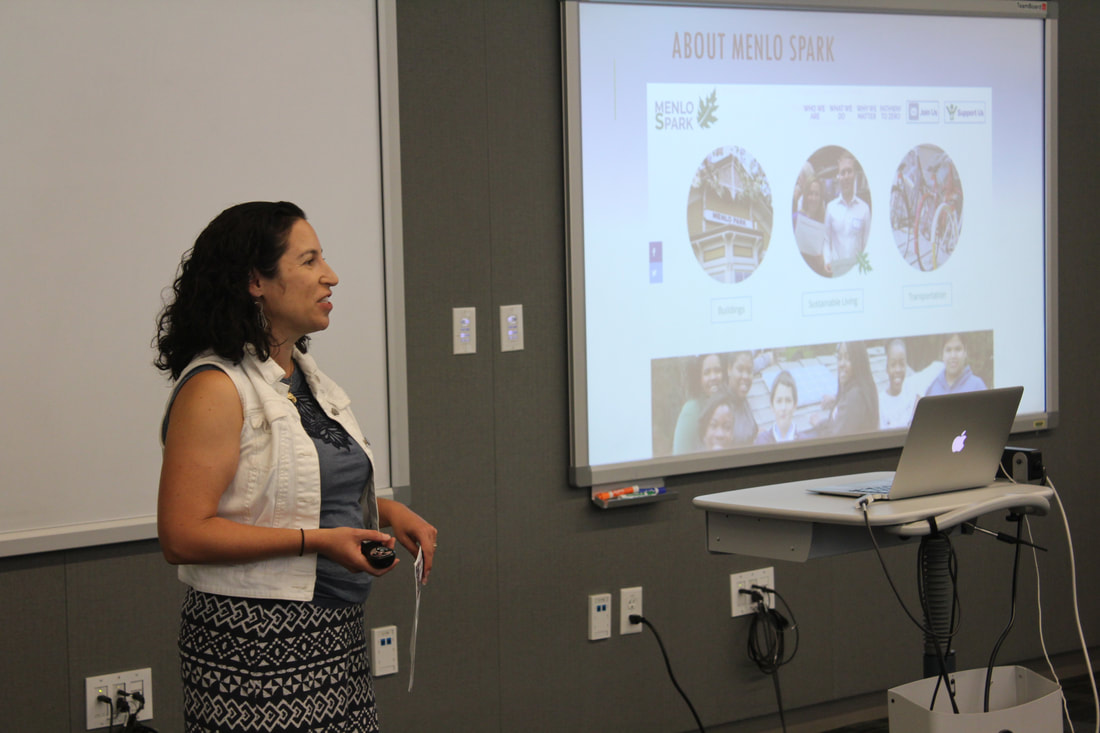
This week, our team met with a our community partner, Diane, representing Menlo Spark. While meeting, we had the opportunity to ask her questions, and to discuss her visions for the project. Diane expressed her desire to make the site more user-friendly, and tasked us with creating an account and exploring the site before our next meeting. In pursuance of this goal we each made an account on the Green Challenge Website and observed aspects that could be improved to improve the experience of the site’s visitors. As we learned in our Fostering Sustainable Behavior reading, the most sustainable option is not always the most feasible and/or convenient. What We Observed and Learned While the site does have the option to filter actions by difficulty level, we feel that there should be more filtering options that allow the user to select actions by the amount of time and money they are willing to commit to a sustainability project. We believe this tailored approach would increase the likelihood that an individual will take the recommended actions. Another option for tailoring the challenge to a specific individual would be suggesting actions based on survey answers. After you fill out the survey, you are told how you compare to other households in different areas, but are not told how you can improve based on your results. Having concrete next steps that are most relevant to the participant’s current lifestyle would personalize the experience and encourage follow-through. We recognized there were areas where the survey succeeded and others where it needed improvement. For example, there are easily answerable questions like your household’s square footage or your car’s gas mileage. But the survey also asks for unfamiliar values such as the distance you drive or travel (by air) in a year. Perhaps, providing formulas such as “Distance from house to work and back * 5 days a week * 52 weeks in a year = …” Making the math easier for the user could be an area of improvement for the survey. Furthermore, the survey could have a built in calculator for some of that data, increasing the likelihood of user completion and accuracy. Publishing a success story will motivate potential participants to complete actions, but the current story posted on the website is generic and lacking in realism. The current story discusses a family’s conversion to solar energy but oversimplifies the process in an attempt to make the switch seem more accessible and too good to be true for the average consumer. When we interview a family with a success story this quarter, we hope to promote the positive aspects of their green journey while maintaining realism. In other words, we will also poll the family about their struggles and how they overcame these obstacles. In addition, we aim to feature a family whose green living experience is more accessible. Often, people are under the impression that in order to go “green” one must spend a lot of money or make very drastic lifestyle changes. We hope that the featured success story will showcase a family that has made huge strides in improving sustainability by taking relatively simple steps that are accessible to a wide variety of folks in the area. This approach will make the story more relatable, and will encourage other households to take similar simple steps, breaking down the idea that sustainability is hard. Moving Forward From readings and our meeting with Diane, we gathered that convincing people to take action is hard. This is one of the most demanding tasks; getting people to become more sustainable given their different socioeconomic backgrounds, lifestyle, households, and motivation. Moving forward, we’ll come up with concrete solutions for the improvement of the survey and the Solar Success story. The success of the Menlo Green Challenge lies in popularizing it and making it both attractive and accessible. To publicize, we’ll think of ways for spreading the word about the Menlo Green Challenge using social media. Incentivizing the members of the Challenge is equally important. Surveying a diverse test group could help us come up with Sustainable Actions tailored to a variety of lifestyles and attractive prizes that’ll keep the users motivated. This week, our team met with our community partners, Neftali and Daniel, for the first time. We learned about the Neighborhood Empowerment Network (NEN) and its mission to help communities establish good practices that enable them to be resilient in the face of disasters or other unforeseen challenges. In particular, we are to work on a subproject of the NEN called the Strong Homes Campaign, which helps neighborhoods on the outskirts of downtown San Francisco come up with ways they can react in a disaster. The NEN is planning to put together a charrette with field experts to create a disaster toolkit that can be used in pair with this consultation service.
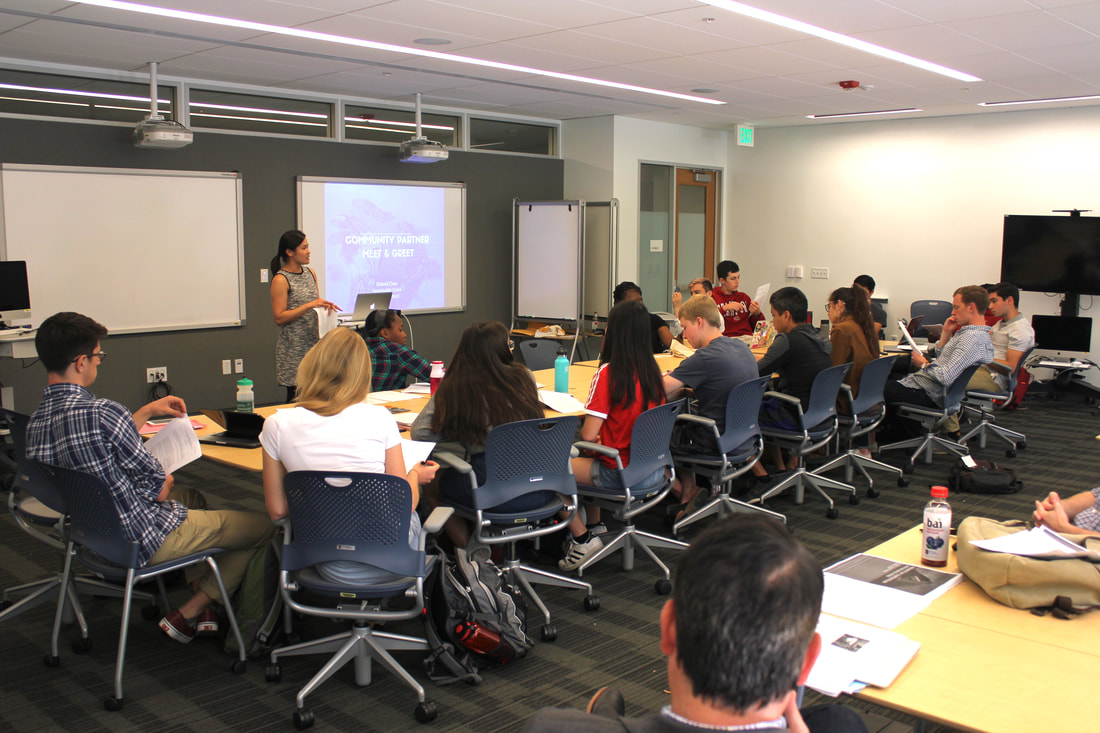
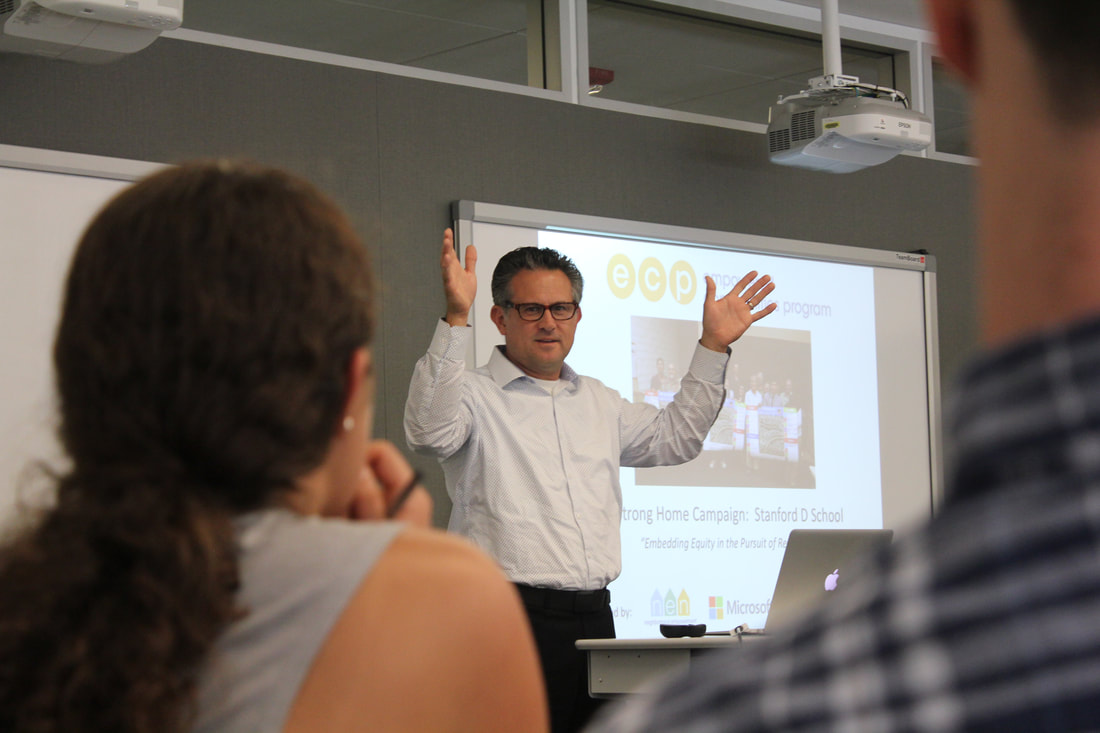
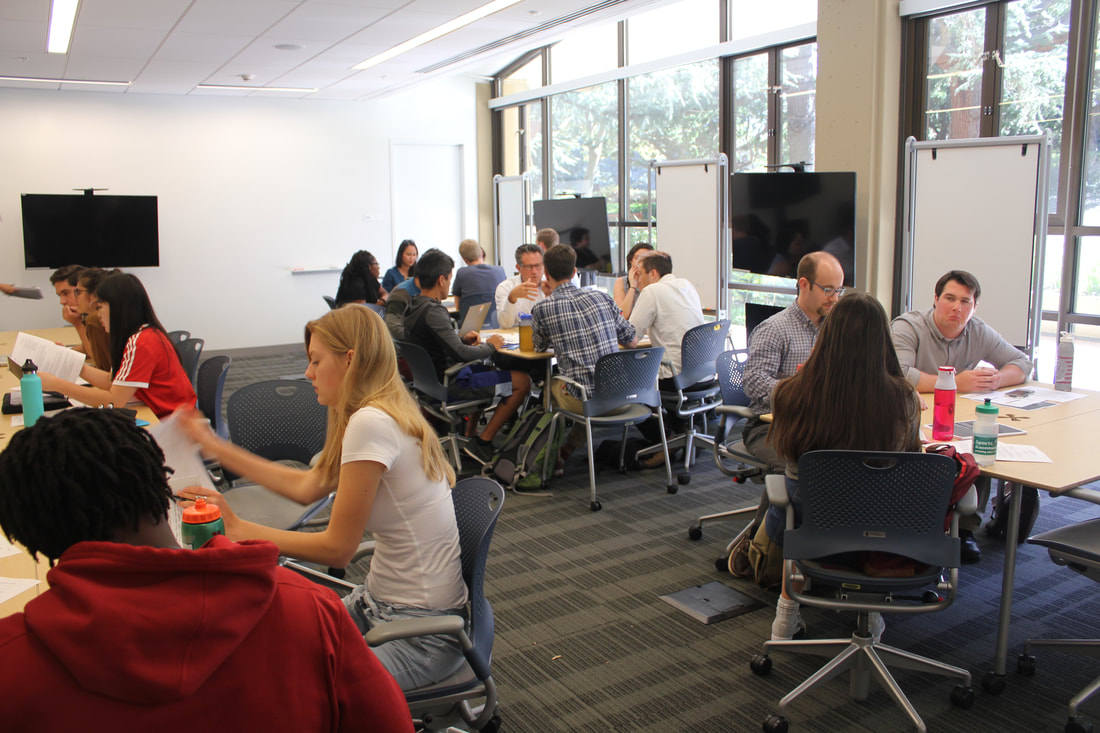
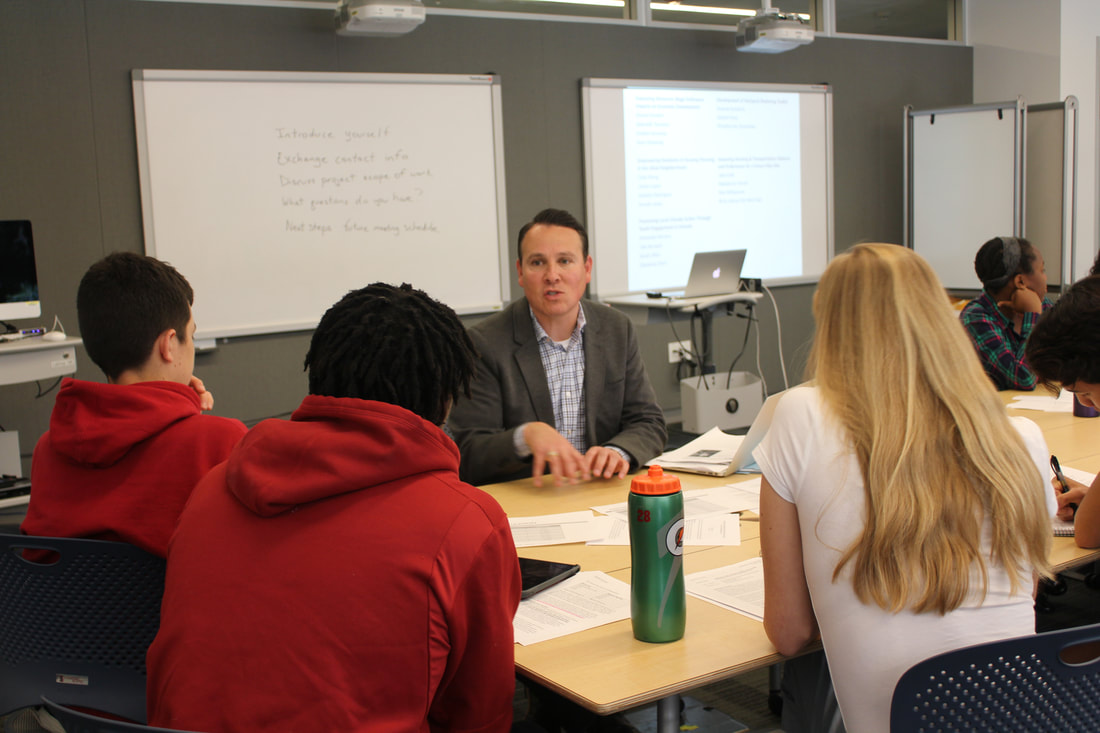
Having discussed ethical service in class, we feel it necessary to raise some questions about the project that may challenge some aspects of service we have deemed critical. For example, the charrette seems to be a place for experts to share opinions, but will not have any input from the direct community. What are the ramifications of this approach? Furthermore, we are skeptical of the comparisons Daniel makes between Puerto Rico and San Francisco. Considering cultural/political/economic differences, how realistic is that comparison? Such questions are worth asking since the impact of preparing a project for community survival requires utmost attention to detail. These are not issues that can be taken lightly, so we must be constantly critical of decisions we are making to check whether our product will be realistically useful in real world situations. Following our meeting in class, we were assigned to take over updating the project plan, and were invited to a conference call on October 6th to discuss our roles in the charrette in more depth. We found out that our role is to moderate and take notes of the discussions in the charrette, as well as give a 10-15 minutes presentation on events happening in Puerto Rico and what lessons could be learned from the disaster there. Based on the results of the charrette, we are then to put together a plan for the toolkit. For our presentation, we personally would like to also consider other scenarios, such as Hurricane Harvey in Houston and the recent 7.1-magnitude earthquake in Mexico City as other applicable analogies for a potential disaster in San Francisco. In an effort to abide by the Principles of Ethical Service as outlined by the Haas Center, we will make sure to seek advice from our community partners first and respect their expertise. This ties into the question posed by the same principles: Is it appropriate and valuable to mutually establish a partnership agreement or a MOU? In our case, we need to decide whether our Stanford team acts independently or “under the wing” of the NEN. Recent events in places such as Mexico City, Houston, and Puerto Rico have demonstrated that members of the impacted community are a great reactive force in helping a city recover from a natural disaster. Should a similarly devastating event hit the Bay Area, we imagine that the members of our local communities will be just eager to help each other out. After all, during a major disaster altruistic actions feel like the natural calling. But what about when we, as a city, are not immediately faced with a major disaster? In these times, many of us do not have disaster service at the forefront of our mind. Thankfully for us in the Bay Area, we have the NEN which is taking proactive actions by helping our communities prepare for such an event. The USGS currently estimates a 72% chance for the San Francisco Bay Region to experience an earthquake of magnitude 6.7 or greater by 2043. A quake of this size can sufficiently damage many of San Francisco’s resources including streets, highways, private buildings, and public areas. Additionally, damage within the integrity of water lines and waste systems would not be surprising. For a city like San Francisco which may have much of its population stranded within its perimeter after such an event, how can further damage or loss of life be mitigated? This is where NEN’s toolkit plays a vital role. NEN’s toolkit will prove to be an invaluable tool to the citizens of San Francisco, but it is not yet complete. There are still many things to be ironed out and much more to be considered. In the coming weeks, our team hopes to ask the questions that will help the professionals of NEN build the best version of the toolkit. Our questions include the following: What can citizens do to maintain their security from opportunistic criminals? Camping on one’s own personal property for up to 3 weeks has been discussed; what about for citizens who do not have personal property they can utilize? Can the toolkit assist them in an alternative way? Possibly by instructing them on how to safely exit the city or how to survive for up to 3 weeks in a public space? Our team has much to learn as far as how we can help in the creation of this toolkit. Researching past events, analyzing the struggles that citizens had during these events, and understanding how these struggles could have been mitigated is only the beginning of it all. Our Fall 2017 Sustainable Cities officially kicked off today with our first Meet and Greet with Community Partners.
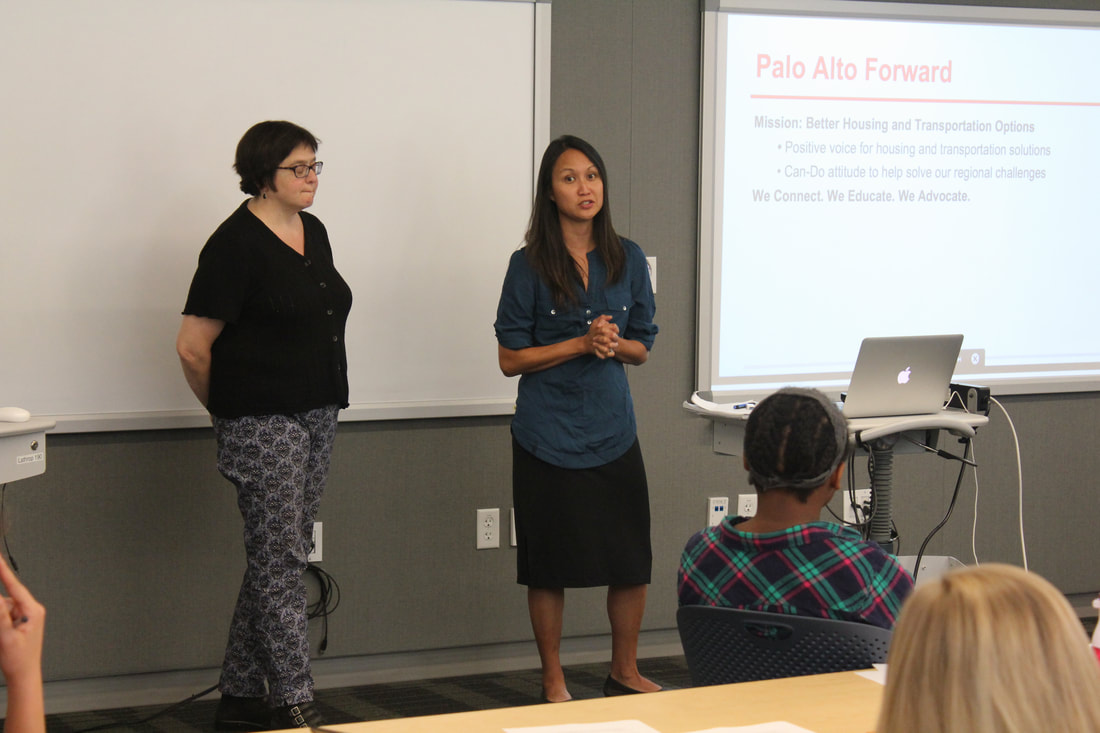
Now in its ninth year, Sustainable Cities is a service learning course offered through Stanford University’s Program on Urban Studies. Participants in the course engage in hands-on, experiential learning while they work collaboratively with Bay Area government agencies and community organizations to support their sustainability goals. The class is open to advanced undergraduate and graduate students from a multitude of disciplines, ranging from urban studies to civil and environmental engineering to earth systems and public policy, to support clients on meaningful fieldwork-based projects. The Fall 2017 class will work on the following projects: 1) Development of Backyard Sheltering Toolkit — Partner: City and County of San Francisco Neighborhood Empowerment Network 2) Empowering Residents in Housing Planning in the Alisal Neighborhood — Partner: City of Salinas 3) Evaluating Minimum Wage Ordinance Impacts on Economic Development — Partner: City of Mountain View 4) Promoting Local Climate Action Through Youth Engagement in Schools — Partner: Menlo Spark 5) Assessing Future Housing and Transportation Patterns in the City of Palo Alto — Partner: Friends of Caltrain and Palo Alto Forward Follow our adventures here on this blog throughout the quarter! |
Archives
November 2020
Categories
All
|


 RSS Feed
